BDSwiss App
Download & start trading

Rates as of 05:00 GMT
Market Recap
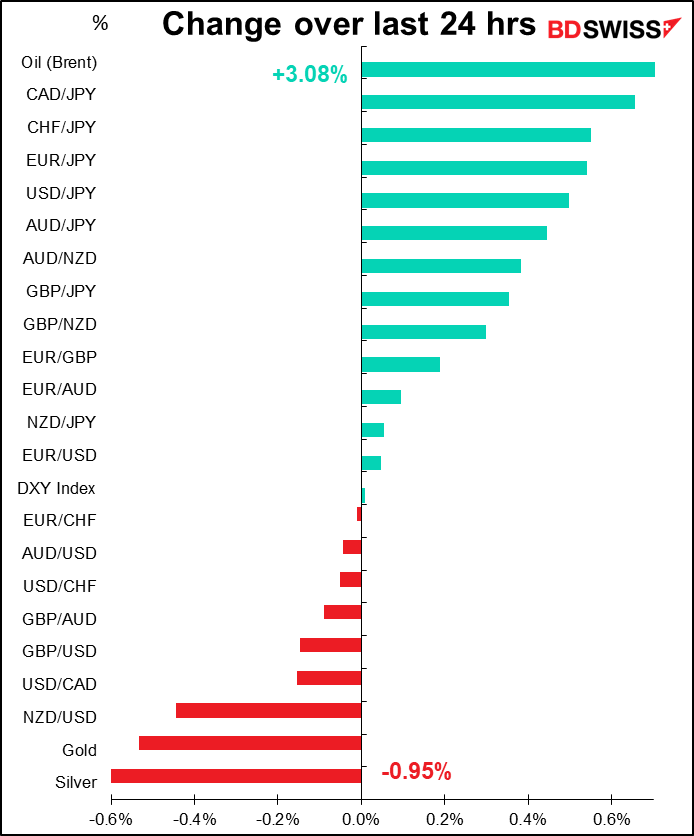
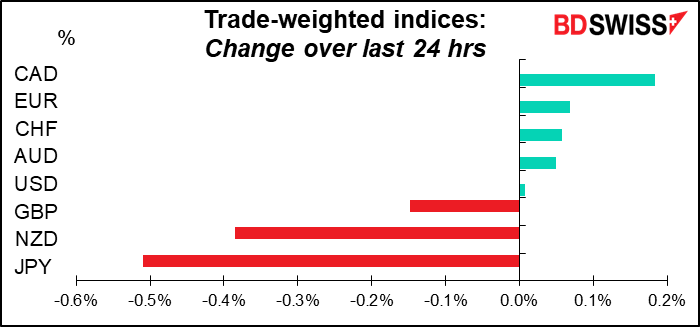
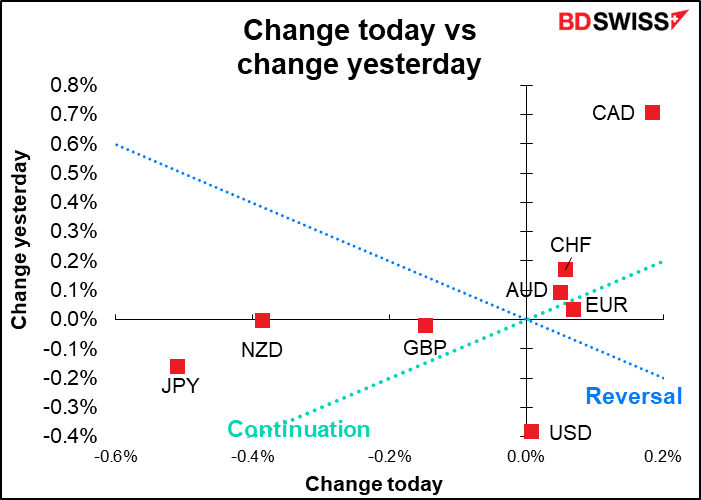
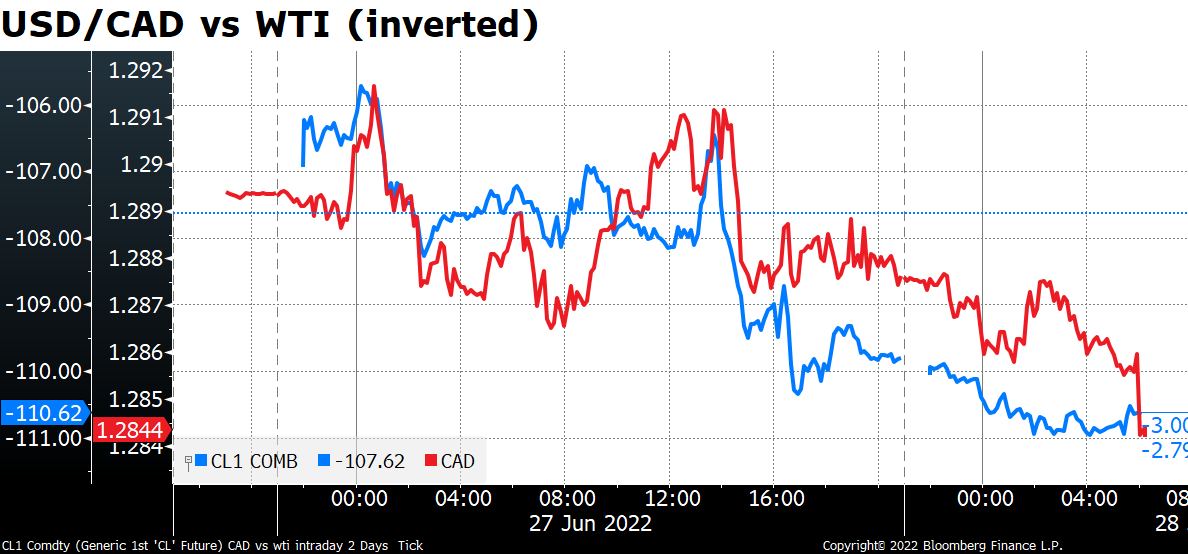
CAD was the big winner overnight and we don’t have to go far to find out why. It seems to be the usual: oil.
So let’s then ask, why is oil higher? Two OPEC members are facing disruptions:
Libya’s state oil company said it may suspend exports from the Gulf of Sirte, which contains many of the country’s main ports, in the next three days amid a worsening political crisis. And Ecuador said oil output continues to drop after about 18 days of protests that shut wells and threaten to bring production to a complete halt. The two countries combined are currently pumping around 833k barrels a day (b/d).
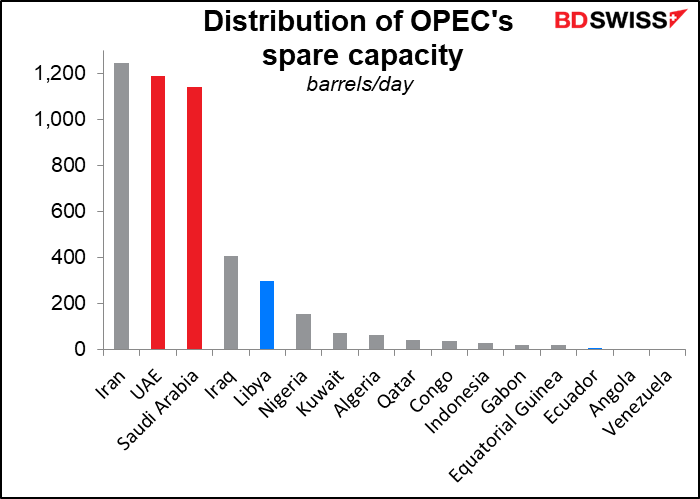
Meanwhile, French President Macron said the UAE’s leader confided in him that the UAE was already at “maximum” output and Saudi Arabia can only increase production by some 150k b/d. This comes as quite a shock because according to generally accepted data (eg Bloomberg’s figures), Saudi Arabia has 1.14mn b/d spare capacity and the UAE has 1.19mn b/d. These two make up 68% of what people thought was the spare capacity in OPEC (excluding Iran). If those two don’t actually have any spare capacity and Libya and Ecuador are nearly knocked out, then OPEC+ is maxed out already.
This chart shows what the market had thought OPEC’s spare capacity was.
We may find out more on Thursday, when OPEC+ meets. The group has already agreed to stick to their scheduled increase in supply for August, although it’s doubtful whether they can actually increase supply. The big question is, what will they do after their agreement ends in August? US President Biden will travel to Saudi Arabia in mid-July to discuss such issues.
According to the New York Fed’s Oil Price Dynamics Report, it’s supply issues that are pushing up the price of oil, not demand. Today’s news will therefore exacerbate the fears over supplies and could push oil prices still higher.

The speculative community is long oil, as they always are, but not unusually so. This suggests to me that the price can go still higher for now.

What would higher oil prices mean for the global economy? Well, we’ll find out more about what it might mean for Europe later today when the European Central Bank (ECB) symposium in Sintra, Portugal takes up the topic of Energy price volatility and energy sources in Europe (see below). There’s also a new paper out from the New York Fed last week, “How Could Oil Price and Policy Rate Hikes Affect the Near-Term Inflation Outlook?” This paper combines the oil price decomposition analysis given above with yield curve data. It concludes that “inflation will likely remain elevated through the second quarter of 2023, despite payback for the inflationary impact of current negative oil supply shocks during the second half of 2022 and the disinflationary effects of tighter monetary policy.” However, it also notes that there is “a higher likelihood of a larger-than-expected easing of inflation in the United States compared to the euro area. The projected inflation easing in the United States is mainly driven by a reversal of the inflationary impact of recent oil supply shocks and monetary policy tightening, while in the euro area tighter monetary policy has a less prominent impact.”
What do the authors mean by “a reversal of the inflationary impact of recent oil supply shocks”? They argue that while soaring oil prices now may be a major cause of inflation, over the next year they’re likely to be a major cause of slowing inflation. That’s because higher oil prices now will act as a drag on the economy, helping to slow economic activity and thereby bring down inflation later on in much in the same way that higher interest rates will. (As the authors put it, “there is an important role for disinflationary payback in the latter part of 2022 for the current inflationary consequences of recent adverse oil supply shocks, driving the downside risk to the forecast.”)
As for why NZD did so badly…the only thing I can find is a report that the kiwifruit harvest missed its target as bad weather affected yields and there weren’t enough migrant workers to pick them. I doubt whether that was the real cause however. Monday was a holiday in New Zealand and as the markets roared back to life there, the two-year swap rate fell to 4.16% from 4.24% on Friday (it was quoted at 4.19% Monday).
Otherwise I’m surprised at NZD’s decline. China eased some COVID-19 restrictions today, such as reducing quarantine times for inbound travelers by half, after Beijing and Shanghai said they had no new locally transmitted infections on Monday. This should be good news for countries that export to China, such as New Zealand.
As for the yen….No big change there, just the news that the Bank of Japan now owns over half of the Japanese Government Bonds (JGBs) in issue.(514.9tn out of 1,021.1tn = 50.4%). This is going to make it increasingly hard for the market to function. Previously the BoJ had to give up its efforts to control yields for fear of destroying the market. A lot of traders are betting that that will happen again. In which case, this news should eventually be positive for JPY. It seems to me that the bond market and the FX market are on opposite sides of this trade, with the bond market taking the view that the BoJ will have to give up some time and the FX market saying no, it won’t.
Russian default
I forgot to mention yesterday that Russia was declared in default on its bonds on Sunday. Unfortunately bonds aren’t usually printed anymore but rather are simply kept as blips in a computer somewhere. This is unfortunate because defaults used to be good for one kind of investor: bond collectors. I happen to have such a collection, including a few pre-revolutionary Russian bonds. But I imagine even if they were available in a paper version, they wouldn’t be as beautiful as the old ones were.

Today’s market
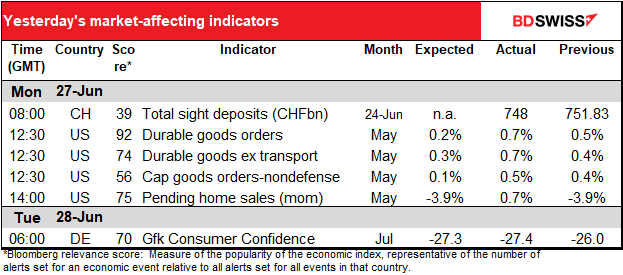
Note: The table above is updated before publication with the latest consensus forecasts. However, the text & charts are prepared ahead of time. Therefore there can be discrepancies between the forecasts given in the table above and in the text & charts.
The European Central Bank (ECB)’s annual conference at Sintra, Portugal gets giong today. The schedule is:: “Globalisation and labour markets in the post-pandemic economy” (chaired by ECB Chief Economist Lane),“Energy price volatility and energy sources in Europe,” and “Central bank digital currencies (CBDCs) and the digital euro project.”
While it doesn’t have anything to do with policy right now, I’m particularly interested in the latter conference. The ECB seems much keener on creating a digital euro than the Fed is about a digital dollar. Several Federal Reserve Board Governors have made speeches poo-pooing the idea, such as Gov. Waller’s CBDC: A Solution in Search of a Problem? or former Gov. Quarles’ Parachute Pants and Central Bank Money. (I have to admit I didn’t know what “parachute pants” are and what they had to do with CBDC.) One of the people on the panel discussing this issue is Neha Narula, Director, Digital Currency Initiative, MIT Media Lab. He’s engaged, along with the Boston Fed, in Project Hamilton, which is experimenting with various technologies for CBDC. So we’ll get an update on where the US is on this now.
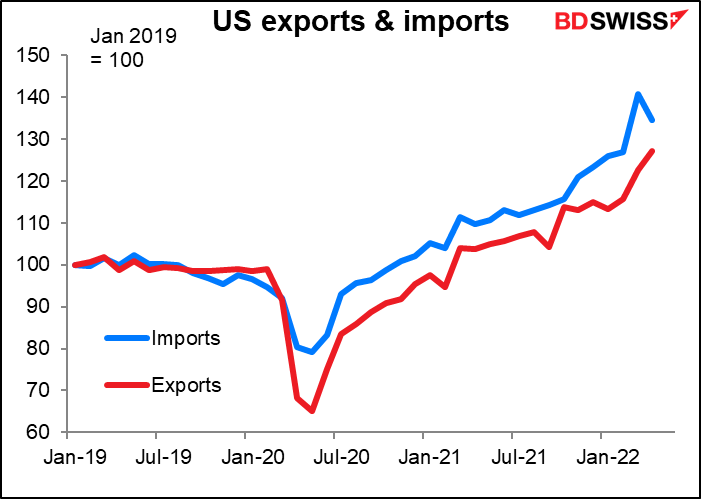
As for the indicators, the US merchandise trade deficit is expected to narrow a bit further. Nobody really cares about this.
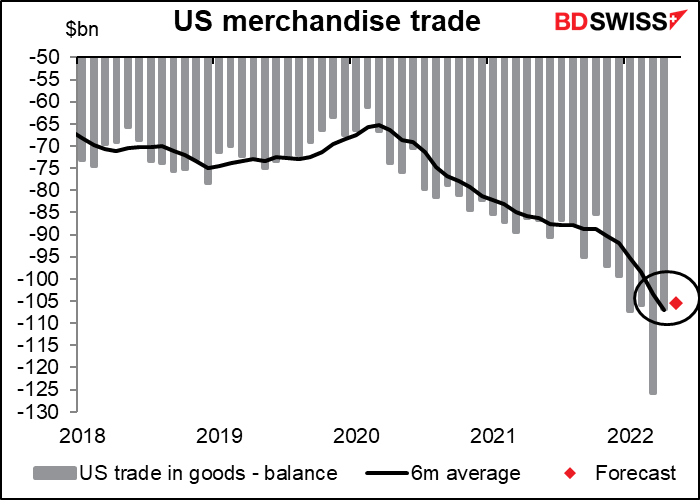
In case you’re interested, the retreat from the record deficit in March was 2/3rds due to a fall in imports (-$13.0bn) and 1/3rd and increase in exports (+$6.1bn).
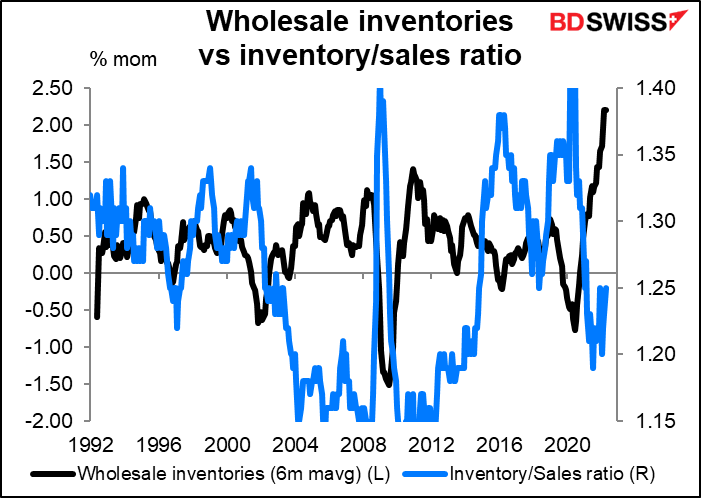
Next up are US wholesale inventories. I didn’t used to cover this but nowadays it’s important as people focus on supply chains and production bottlenecks. Inventories have been rising substantially for quite some time now – it may well be that at some point, businesses start to think inventories are too high and start cutting them, possibly by reducing prices. That would reduce inflation substantially.

So far though the inventory-to-sales ratio is nothing outside the ordinary, so that’s not likely to happen unless demand starts to contract substantially.
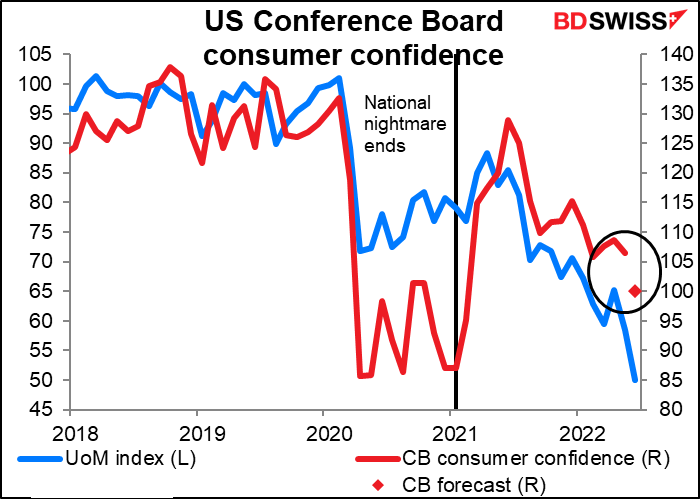
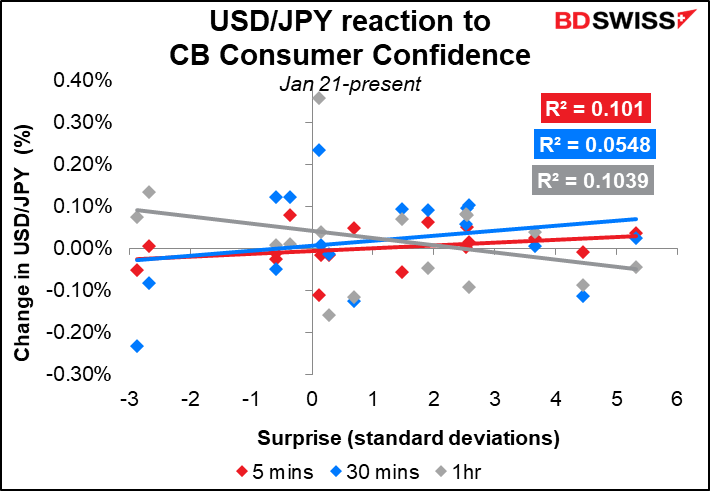
The Conference Board consumer confidence index is expected to plummet. Not as badly as the U of Michigan version has plummeted, but pretty badly. The two have had a record divergence recently as the Conference Board measure is more heavily weighted towards the labor market, which is doing quite well, while the Michigan survey emphasizes longer-term macroeconomic expectations, such as inflation. Personally I think the Conference Board index is much more reliable as they interview 2,500 people for the preliminary index and 3,500 for the final revision, vs only 250-300 people initially and 500 for the final version of the U of M index.
In any case, they’re both declining so the only question is how bad sentiment is.
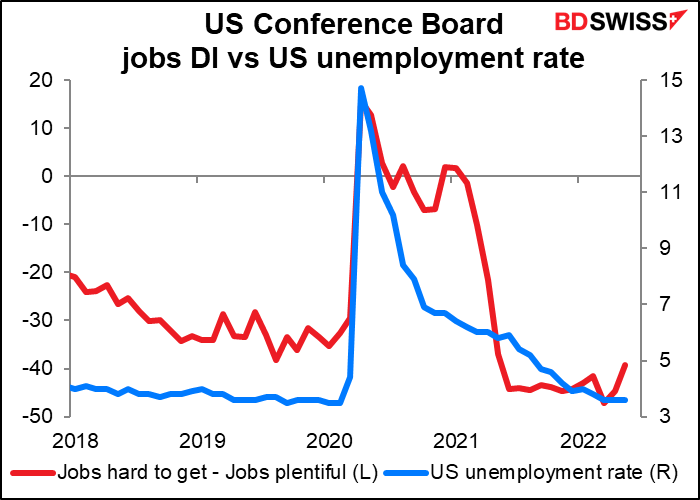
People will also be watching the Conference Board jobs diffusion index (DI) – the percent of people who say jobs are hard to get minus those who say jobs are plentiful. This has a pretty good track record of predicting the US unemployment rate. It’s started to move up, which may indicate a deteriorating labor market.
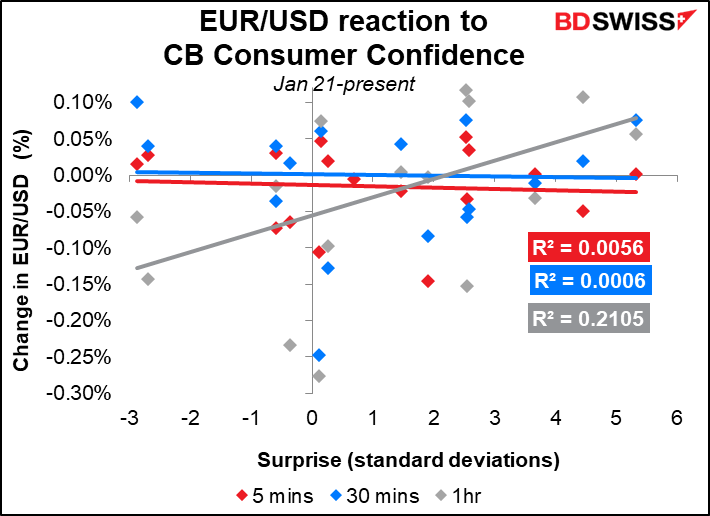
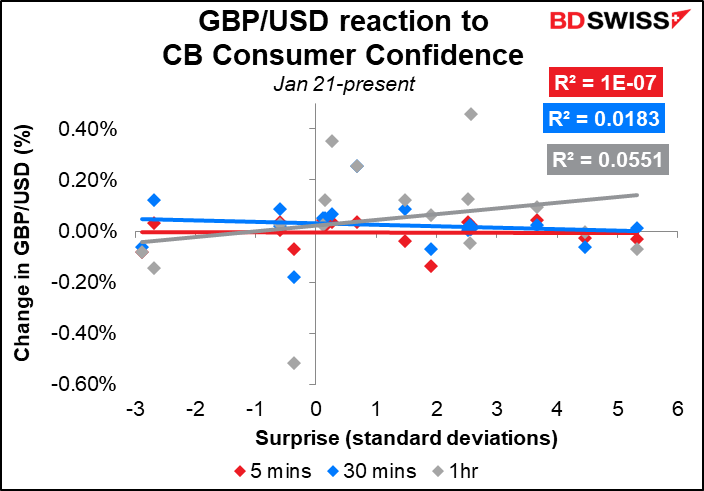
Although this indicator has one of the highest Bloomberg relevance scores of any US indicators, currencies don’t seem to take their cue from it very closely, if at all. Perhaps it’s more important for stock market investors than for FX folks.
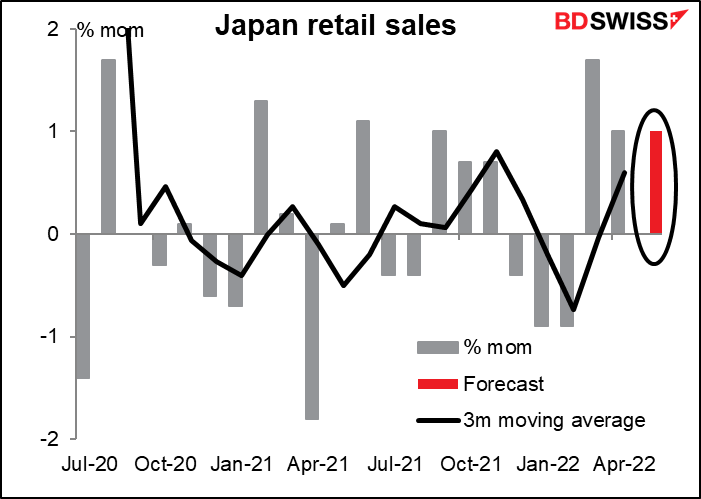
Overnight, Japan’s retail sales are expected to be up about as much as they were in the previous month. But nobody really cares that much about Japan’s retail sales – the government at least cares more about production than consumption. At least it used to. I left there 17 years ago so my information may be out of date.
There’s another Japanese indicator coming out that I’ve never covered before but is worth watching at present: Japan’s consumer confidence index. Actually not so much the index itself…
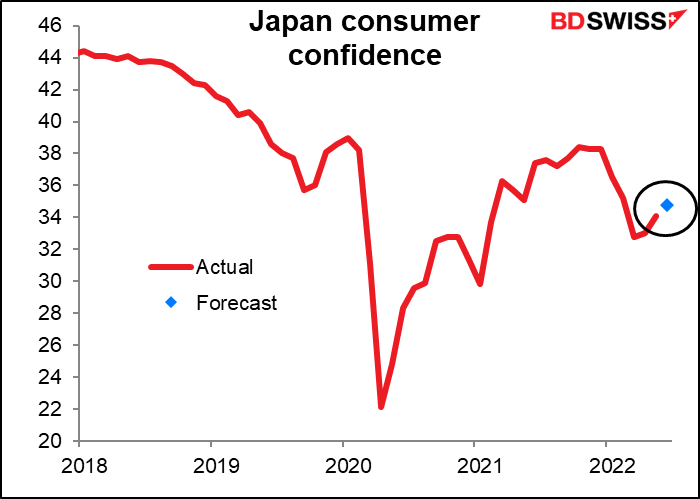
…but rather the inflation projections that are included with it. Among the questions the Economic and Social Research Institute asks are, what do you think inflation will be a year from now? Last month, 54.8% of the people said “above 5%” while 29.5% said “between 2% and 5%.” In other words, 84.3% of the people thought the BoJ would hit or surpass its price target.
Note how rapidly the “over 5%” section has increased. In September last year it was 19.3%, in January this year it was 31.6%, and now it’s over 50%. So inflation expectations among the Japanese populace are rapidly becoming “unanchored.”

The key question here is the combination of consumer sentiment and inflation expectations. If indeed consumer sentiment improves (as the market expects) while inflation expectations continue to rise, then perhaps (as BoJ Gov. Kuroda said) people are indeed becoming inured to inflation and the politicians & BoJ don’t have to worry about it. On the other hand, if consumer sentiment falls as inflation expectations rise, as is happening in the US, then maybe it will start to become a political issue.
A recent BoJ survey showed that 82% of the respondents thought the rise in prices was “rather unfavorable,” with only 4% saying “favorable.” So while the economists at the BoJ may feel that the economy works better with moderate inflation, the average Japanese person begs to differ.
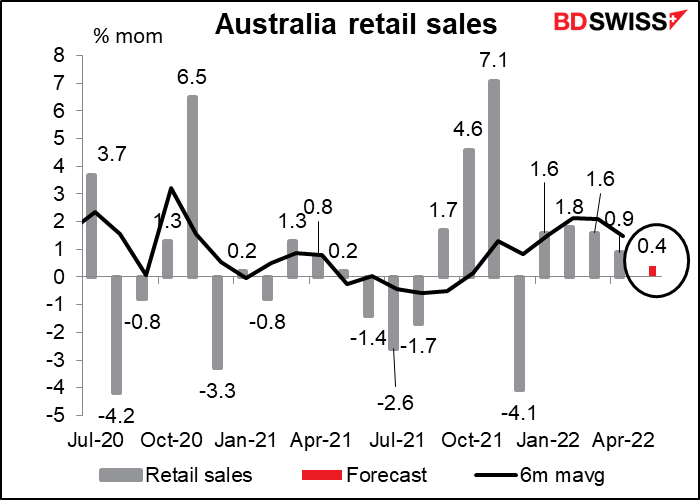
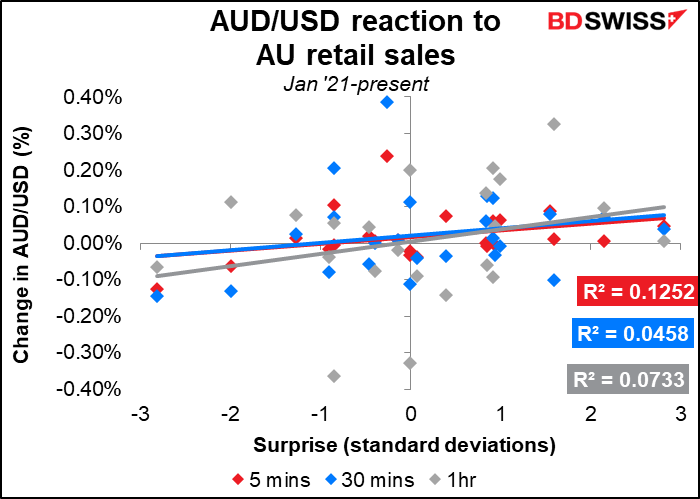
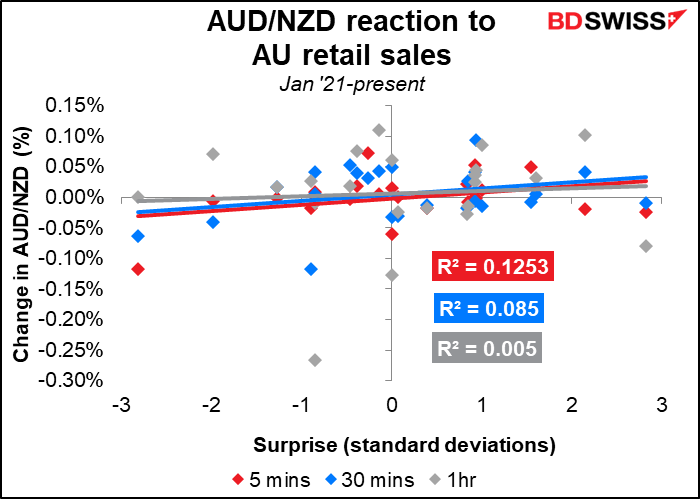
Australian retail sales have grown fairly well this year but are likely to have slowed somewhat in May as spending rotates towards nonretail items, not to mention diverted to rising fuel costs and interest rates. Also consumer sentiment has been falling: it fell 5.4 points to 90.4 in May, according to the Westpac-Melbourne Institute consumer confidence survey.
In any event, the market consensus forecast of +0.4% mom isn’t very high when you consider that the data aren’t adjusted for inflation. Since prices were rising 2.1% qoq in Q1, that would be about +0.7% mom. An increase in sales of +0.4% mom would therefore be a decline of 0.3% in real terms, which I think could be negative for AUD.
Retail sales have some impact on the exchange rate but not that long-lasting.
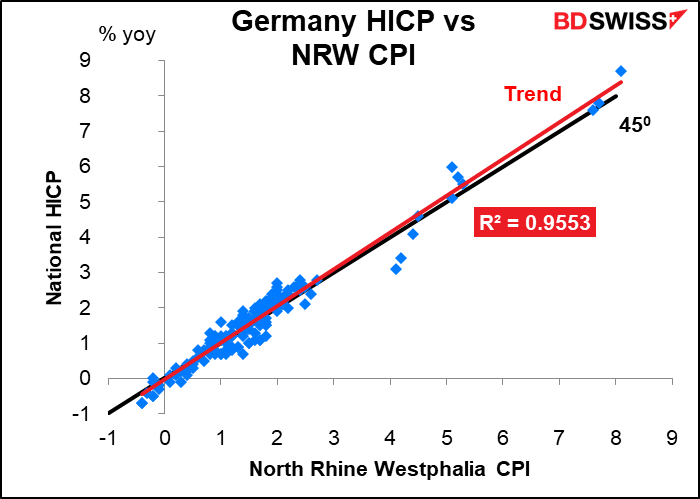
Then extremely early in the European day we start to get foreshadowings of the German consumer price index, but I’ll leave that to tomorrow. Just here’s a chart showing the correlation between the change in the North Rhine Westphalia CPI to the national harmonized index of consumer prices (HICP), to explain why I have the former on the schedule.