BDSwiss App
Download & start trading


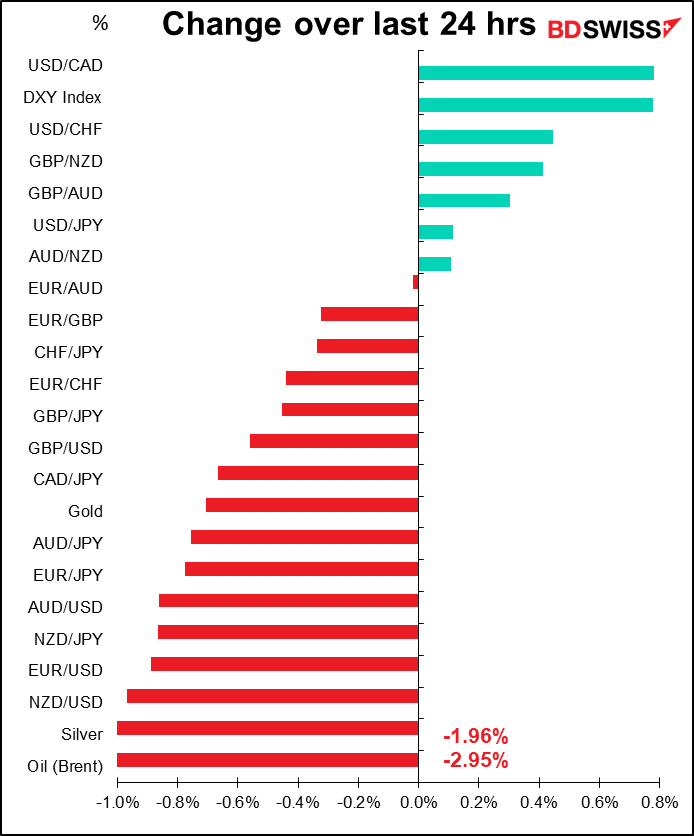
Rates as of 05:00 GMT

Market Recap
I’ve been pretty optimistic about the “soft landing” hypothesis, thanks to the many signs of strength in the US economy. But yesterday something happened to shake my confidence. The Empire State manufacturing survey plunged 42.4 points – the second-biggest drop ever in the 21 years of the survey. (The only bigger decline was in April 2020, when the pandemic hit. The survey fell 56.7 points then.) The fact that we would get a fall on that scale with no pandemic, no stock market crash, no hurricanes or volcanoes or tsunamis…it’s a shock.

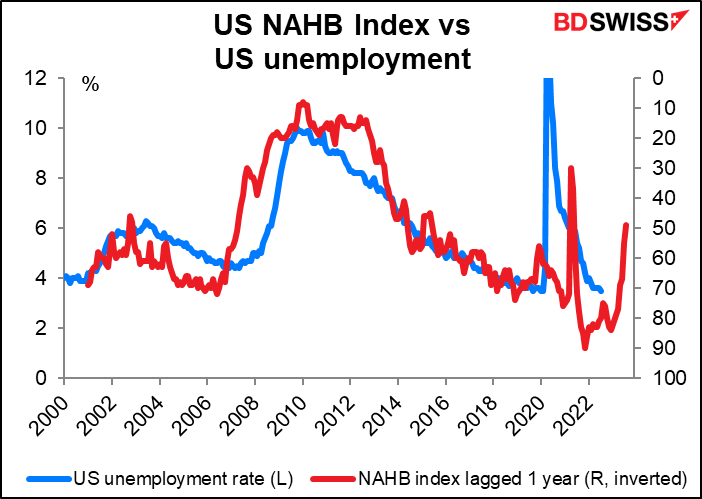
Note too the much larger-than-expected fall in the National Association of Home Builders (NAHB) index. That was the eighth consecutive decline in the index, which is sometimes seen as a leading index for the US economy as housing is so important.
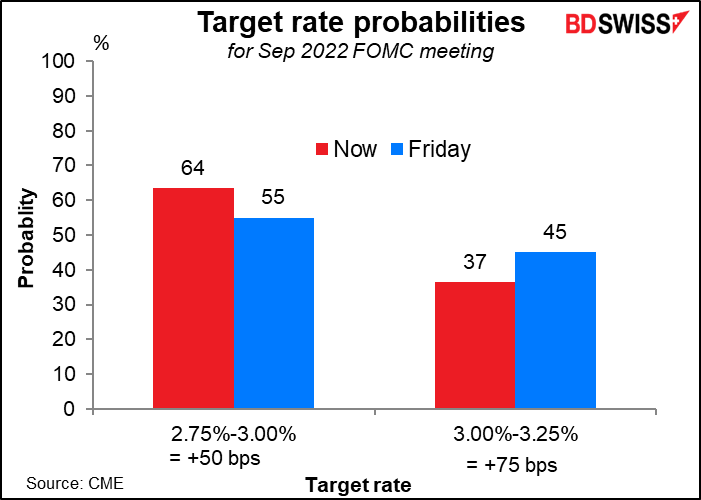
Against this background, the odds of the Fed hiking 75 bps in September fell further.
There were also signs of weakness in China. Following Monday morning’s disappointing data on retail sales and industrial production, the People’s Bank of China (PBoC) surprised the market by cutting its 1-year medium-term lending facility rate by 10 bps to 2.75%. By doing so, they are resuming their easing cycle and trying to improve its transmission to the credit markets, as the PBoC’s easy monetary policy hasn’t been able to permeate the real economy due to the difficulties in the housing market and the COVID-19 disruptions to economic activity.

Economists expect that the next move will be cuts in both the 1-year and 5-year loan prime rates, which would translate into lower mortgage rates and thereby help to boost the sagging Chinese property market.
The slowdown in China spilled over into the Antipodean currencies (especially NZD, as I pointed out yesterday) and the oil market. Oil was also hit by the prospects of increased Iranian supply after Iranian Foreign Minister Hossein Amirabdollahian said in a briefing that the country would inform the EU Monday evening of its position regarding a final draft text for a finalized nuclear deal, striking a more conciliatory tone than in recent months. A spokesperson for the Iranian foreign ministry said there could be a basis for a signed agreement “in the very near future.”
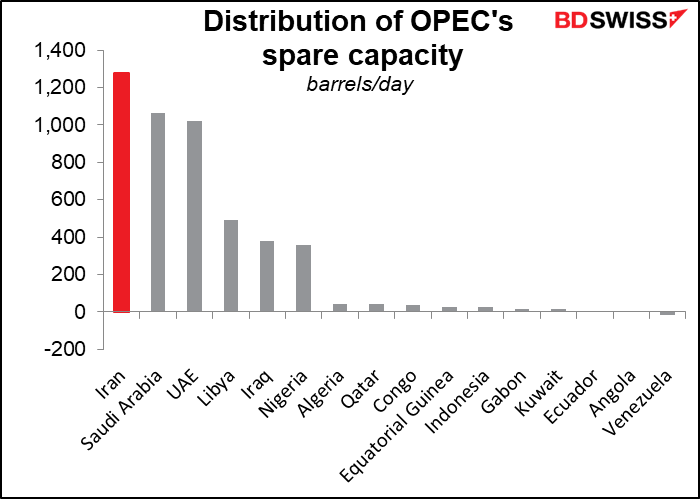
As the graph shows, Iran has the greatest room to expand production of any of the OPEC countries. The country has some 1.3mn barrels a day (b/d) of unused capacity.
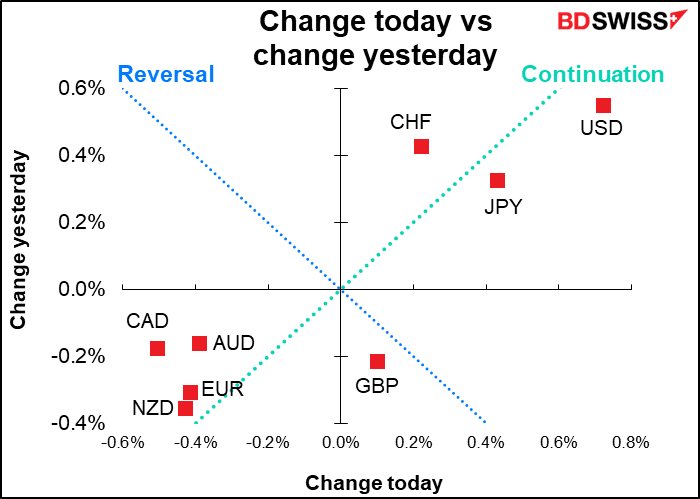
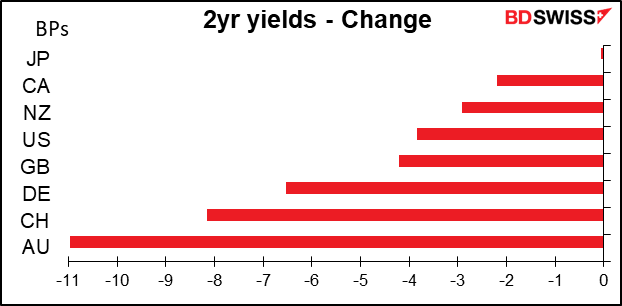
With signs of a slowdown in the US and China, bond yields declined everywhere across the curve.

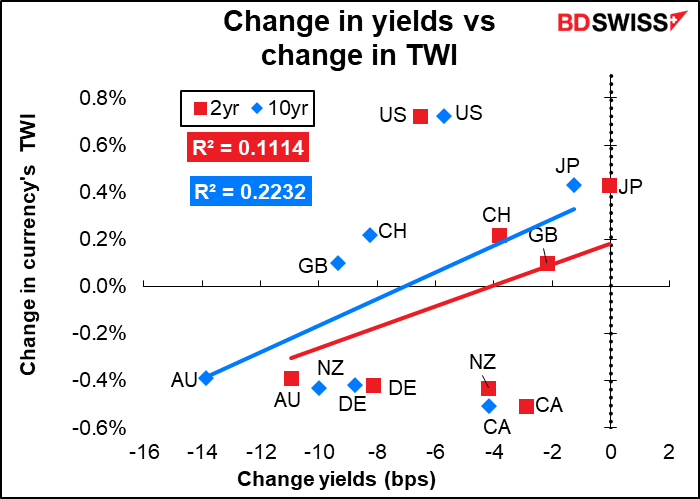
But this was only a loose driver of moves in the currency market. As you can see, USD gained significantly despite its lower yields while CAD and NZD fell far more than the change in their yields would have implied. There was clearly a flight to safety that boosted USD, CHF and JPY and a move against the growth-sensitive commodity currencies, especially CAD as the oil price fell.
I haven’t used this graph in a while. It says pretty much all you need to know about CAD.

One commodity that bucked the trend: European natural gas prices. They continued their seemingly inexorable march higher, with German gas prices up 4.4% on the day and Italian gas prices up 6.2%. This may be one reason why EUR underperformed.

The signs of a slowing global economy sent inflation expectations lower, except in the UK, where the Bank of England has said it expects inflation to hit 13% at some point.

One question though: given the big “risk-off” environment, why were equity prices higher? The S&P 500 rose 0.40% and the NASDAQ index was up 0.62%. Perhaps we’re back to the “bad news is good news” paradigm as Fed rate tightening expectations fade slightly (the expected peak of the fed funds rate next May fell by 6 bps). However at the moment the S&P 500 futures are quoted down 0.2%.
Today’s market
Note: The table above is updated before publication with the latest consensus forecasts. However, the text & charts are prepared ahead of time. Therefore there can be discrepancies between the forecasts given in the table above and in the text & charts.
The big thing today is the Reserve Bank of New Zealand meeting overnight. We’ll get to that in good time.
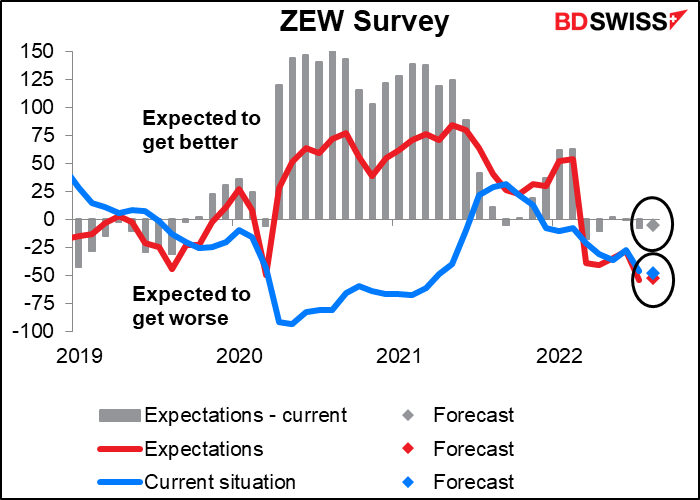
The European day starts out with the ZEW Survey, a survey of economists, analysts, and other parasites on humanity (as opposed to the purchasing managers’ indices, which seek information from people who actually make or do things). It’s more of a sentiment survey than an indication of the direction of the economy.
Both indices fell sharply last month. This month only small changes are expected. The current situation index is expected to fall a bit while the expectations index is expected to rise. This means people still expect the situation to get worse, but not as much as before. I don’t think small changes like this will have much effect on the FX market.
When the North American day begins we get two indicators from Canada: housing starts and the all-important consumer price index (CPI).
Canada’s housing starts are expected to be down for the second consecutive month, although higher than the six-month moving average. I doubt if this will cause many waves though because it comes out just 15 minutes before…

…the Canadian CPI. The market consensus forecast is that Canadian inflation has peaked. The headline rate of inflation (year-on-year) is expected to come down by 50 bps (similar to the performance of the US CPI for the same month, which was 60 bps lower). One of the core measures is expected to be up 10 bps, one unchanged, and one down 10 bps, so no big change there – again, much like the US, where the year-on-year core rate of inflation was unchanged.

Nor is this just base effects – the annualized three-month change is forecast to come down for the second consecutive month. It looks like the worst may be over in Canada, too.

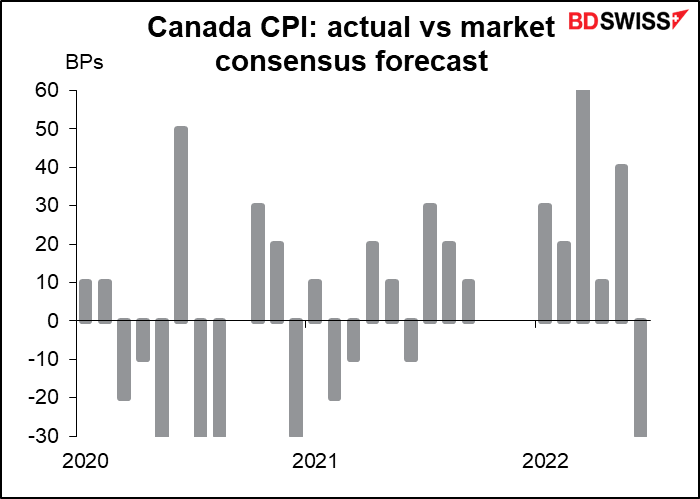
How good are economists at forecasting this indicator? Not very, although that’s normal nowadays with inflation. Since the beginning of 2021 the CPI has beaten estimates 11 times and missed only four times, while the market consensus was spot on thrice. I’d warn you though that things may be different around the turning point. The market consensus for the US CPI of the same month was 8.7% yoy, down from 9.1%, but it turned out to be 8.5% yoy, which was the lowest estimate in Bloomberg. The lowest estimate for this month’s Canada CPI is 7.0% (range 7.0%-7.8%, median 7.6%).
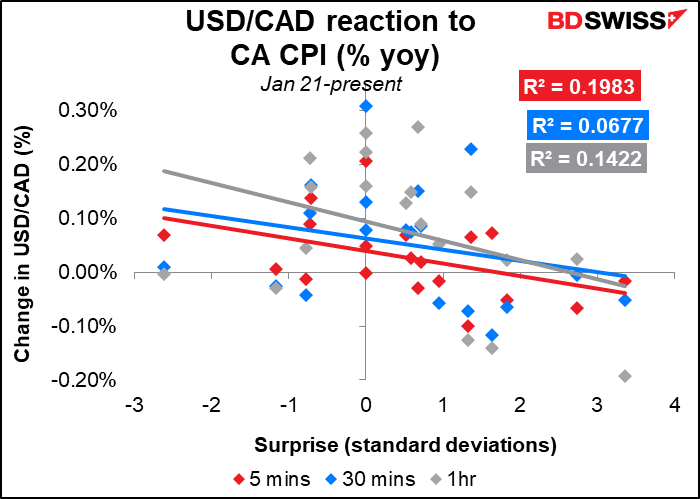
The figure has the expected impact on USD/CAD, but not as strong as one might expect. Other countries’ CPIs have much higher R-squared (a measure of “goodness of fit”).
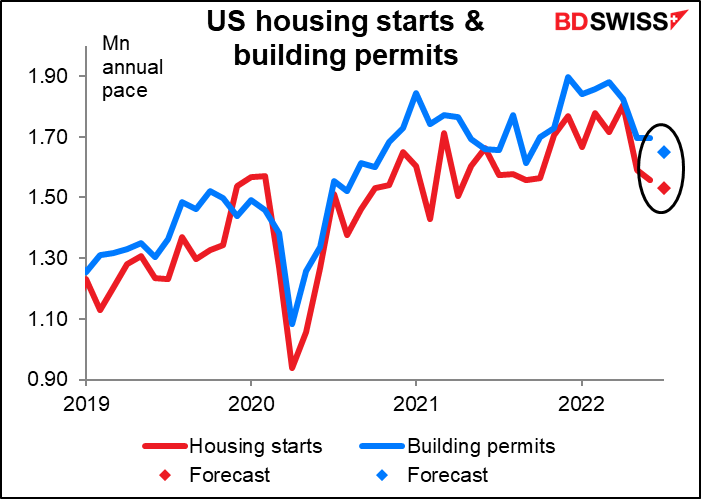
US housing starts are expected to fall by 1.9% mom while building permits are forecast to be down by 2.7% mom. It’s no surprise that higher mortgage rates – nearly doubling in the last year, as I pointed out yesterday – would put a damper on the housing market. That’s a feature, not a bug in the Fed’s policy – this is one way to slow the US economy. Yesterday’s National Association of Home Builders (NAHB) index fell by 6 points, much more than the one-point decline that was expected. In addition, the Fed’s Q3 Senior Loan Officer Survey showed a sharp tightening of mortgage lending standards, which is bound to put a damper on the housing market.
US industrial production has been flagging recently. It’s expected to rise from the previous month but only 0.3% mom, which is pretty weak following a month of only +0.1% mom rise and another of -0.2% fall.

While this is a major indicator for the US, particularly for equity analysts following industrial companies, it’s not such a big indicator for the FX market.


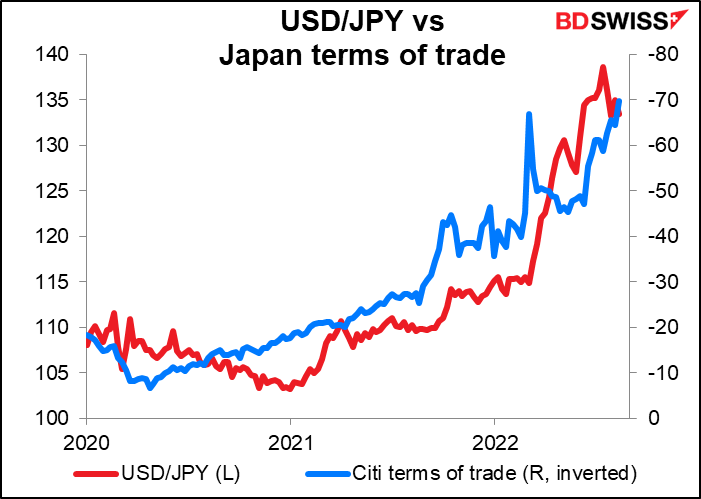
Overnight, Japan’s trade balance is expected to show little change on either a seasonally adjusted or unadjusted basis. Either way you look at it though the country is running an increasingly serious trade deficit.

What this means is that Japan’s terms of trade must be worsening, probably because the price of oil and organic chemicals (which Japan imports) are going up faster than the price of cars and semiconductors (which Japan exports). This should be a negative for JPY. However if oil prices start to decline this trend could reverse rapidly.
Japan’s machinery orders are also coming out. Although the Bloomberg relevance score puts this as one of the most closely watched Japanese indicators, I think it’s pretty useless. Look at the 3-month moving average. No trend at all! What can we say about an indicator that seems basically random?

Furthermore the impact on USD/JPY Isn’t very strong but what impact there is, is the opposite of what you might expect: the yen tends to weaken when the figure beats estimates and strengthen when it misses. So why do I bother writing about it? I have to because it’s such a closely watched indicator. But you can probably ignore it.

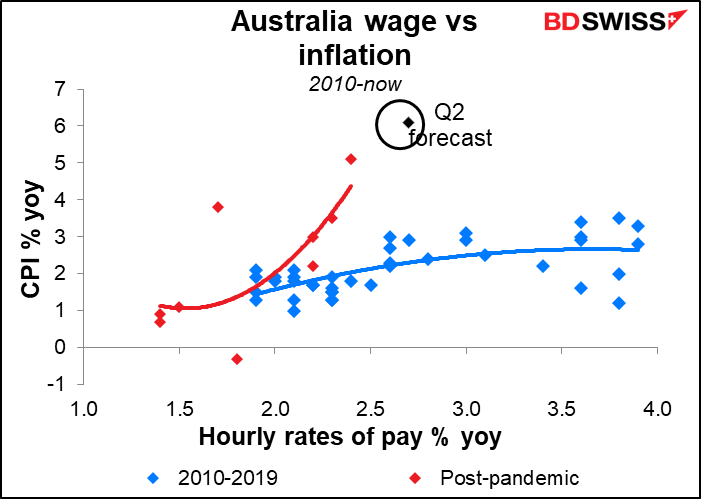
Australia’ wages data is a Very Big Deal as the Reserve Bank of Australia (RBA) frequently pointed to the need for wages growth to get up to a level consistent with inflation in its 2%-3% target range. This data is available only quarterly and so can have a big impact when it comes out. Wages are forecast to have risen 2.7% yoy, which in the pre-pandemic world would’ve been compatible with inflation of around 2.8% yoy – quite firmly within the RBA’s 2% -3% target range. This should allow them to continue to normalize monetary policy, which is likely to be positive for AUD.
Also today, the Australian Bureau of Statistics (ABS) will release an information paper outlining a new monthly CPI indicator. Currently Australia’s CPI only comes out quarterly. Back data from 2018 to June 2022 will be released with that paper. The first monthly indicator will be released in conjunction with the Q3 CPI in October. That means the new CPI will start to affect the market from the November reading as that would show the month-on-month change. If for some bizarre reason you’re really, really interested in this, you can hear ABS Chief Statistician David Gruen explain everything in this podcast (beginning from 11:10). The podcast also includes Deputy Gov. Michele Bullock talking about a possible digital AUD.
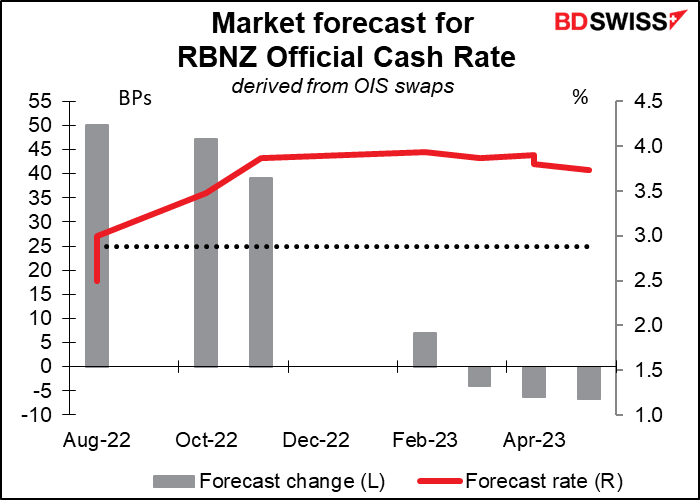
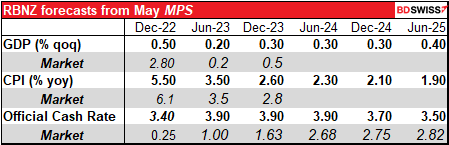
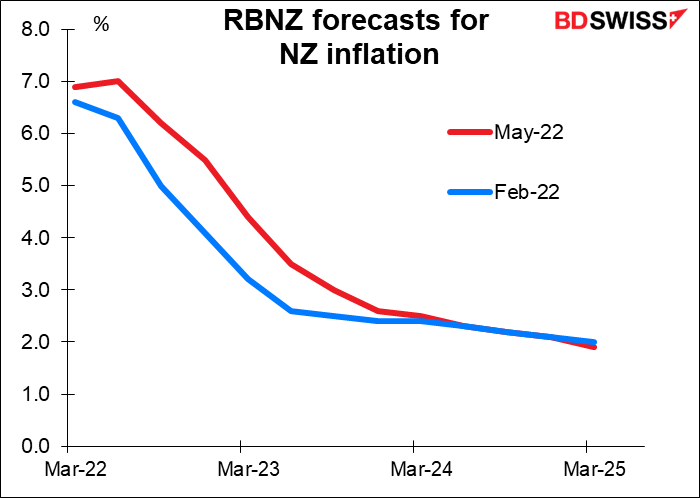
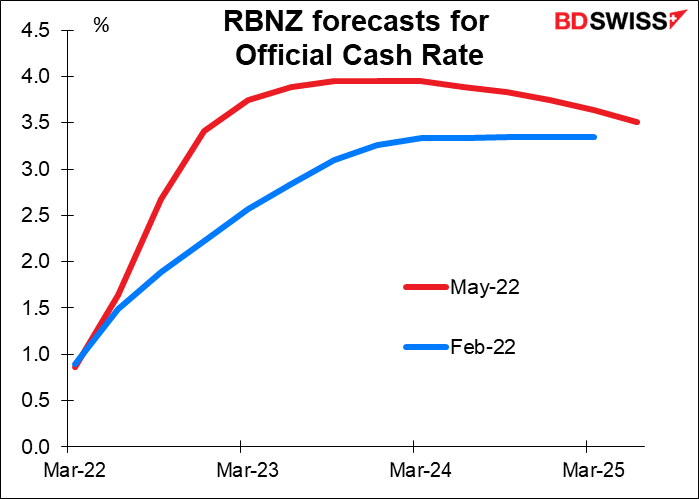
As for the Reserve Bank of New Zealand (RBNZ), it’s assumed that it’s coming to the end of its hiking cycle. The market looks for a 50 bps hike in the official cash rate (OCR) at this meeting, another 50 bps hike in October, 25 or 50 in November, and then basically that’s it.
Also today, the Australian Bureau of Statistics (ABS) will release an information paper outlining a new monthly CPI indicator. Currently Australia’s CPI only comes out quarterly. Back data from 2018 to June 2022 will be released with that paper. The first monthly indicator will be released in conjunction with the Q3 CPI in October. That means the new CPI will start to affect the market from the November reading as that would show the month-on-month change. If for some bizarre reason you’re really, really interested in this, you can hear ABS Chief Statistician David Gruen explain everything in this podcast (beginning from 11:10). The podcast also includes Deputy Gov. Michele Bullock talking about a possible digital AUD.
As for the Reserve Bank of New Zealand (RBNZ), it’s assumed that it’s coming to the end of its hiking cycle. The market looks for a 50 bps hike in the official cash rate (OCR) at this meeting, another 50 bps hike in October, 25 or 50 in November, and then basically that’s it.
Then, Wednesday morning at 7 o’clock as the day begins, Britain announces its CPI. UK inflation is expected to rise further.This will surprise absolutely no one who has been paying even the slightest attention to British affairs. In the August Monetary Policy Report, the Bank of England said, “CPI inflation is expected to rise…from 9.4% in June to just over 13% in 2022 Q4, and to remain at very elevated levels throughout much of 2023, before falling to the 2% target two years ahead.” I would therefore expect a rise in inflation to have little impact on the pound even if other countries, like Canada mentioned above, are starting to see some “light at the end of the tunnel.” In Britain’s case, the “light at the end of the inflation tunnel” is just a train coming at them in the form of the official energy price cap. This cap limits the rates that an energy supplier can charge for their default tariffs. The hikes to these price caps will add thousands of pounds to the average household’s energy bill (and therefore to the CPI) when the next period begins in October.