BDSwiss App
Download & start trading

Some interesting movement this week: Fed Chair Powell expressed his conviction that the Fed is “strongly, strongly committed to restoring price stability” and said that the FOMC “will make whatever moves it believes are appropriate” to achieve that goal, including a 100 bps rate hike if necessary.
That was pretty hawkish stuff. 100 bps hike? Wow! So why did USD decline? Probably because his comments increased the risk of the Fed tipping the US economy into recession.
Although Powell argued that the US economy was “very strong and well positioned to handle tighter monetary policy,” he acknowledged that it will be “very challenging” to avoid a recession while raising rates and admitted that a recession was “a possibility.” That’s about as far as he’s likely to go in advance of the economy collapsing.
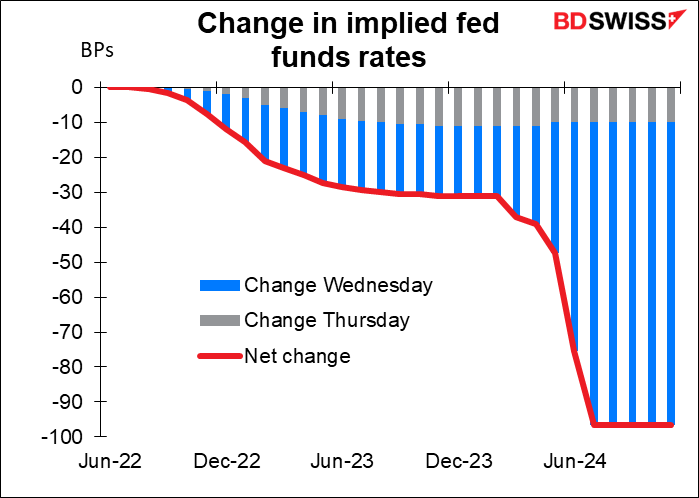
The market took his words to heart. Even though he didn’t balk at the idea of a 100 bps hike, the fed funds futures started to price in less tightening in the next year or so and more easing in 2024, presumably on the assumption that the Fed will drive the US into recession and have to loosen again by then.
Well…will it?
It just so happens that some people in the Fed’s research department are thinking about this exact same question (gee, I wonder why). On Tuesday one of the economists working for the Fed’s Board of Governors published a paper, Financial and Macroeconomic Indicators of Recession Risk*. I’m simply going to summarize the article here because, frankly, I can’t do a better job myself so why try?
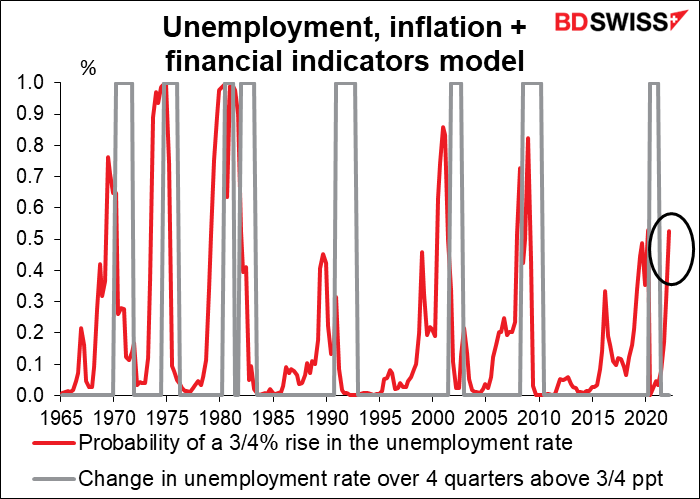
The first point is, how to define a recession. The formal definition of a recession is two consecutive quarters of shrinking output (that’s usually phrased as “negative growth,” but I think “negative growth” is an oxymoron – nothing grows “negatively.” The reverse of growing is shrinking.) However in this case the author says, “The risk of a recession is akin to the risk of a sizable increase in the unemployment rate.” As you can see from the graph, the unemployment rate has risen in every recession, so this is as good an indicator as any.
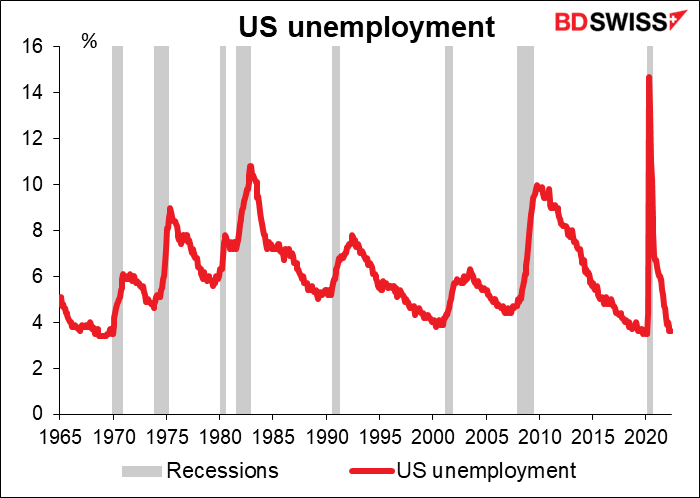
The author defines “a sizeable increase” as a ¾ of a percentage point increase in the unemployment rate. Nowadays that would mean a rise in the unemployment rate to 4.3%-4.4%. That doesn’t sound very “recessiony” to me – the pre-pandemic average for the US (1965-2019) is 5.9%, and the members of the rate-setting Federal Open Market Committee (FOMC) estimate that the equilibrium level of unemployment in the US is 4.0% (guesses range from 3.5% to 4.3%). But I suppose it’s the change that’s important, not the absolute level.
OK…so what are the odds of a ¾ percentage point increase in the unemployment rate? Well, there are several ways to figure it out.
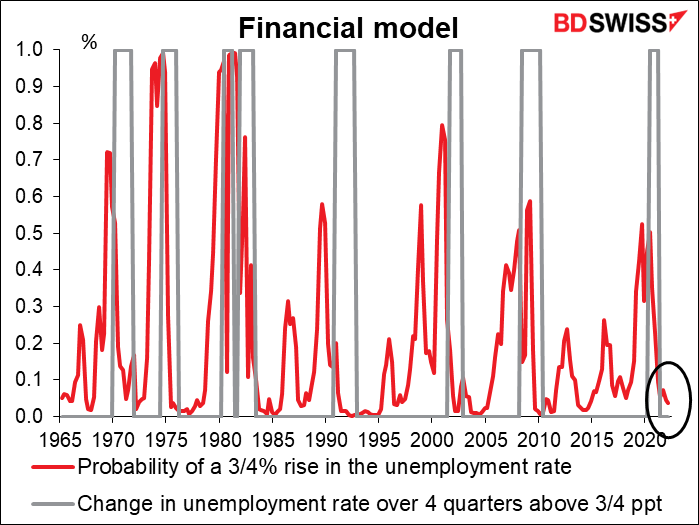
One common approach is to use financial variables on the theory that the market will begin pricing in the likelihood of a recession. This may be akin to “crowdsourcing” your forecasting. Some models use the credit spread (the difference in yield between a risk-free bond and a risky bond), others use the yield curve (the difference in yield between bonds of the same issuer but different maturities). The author uses both: for the credit spread he uses the difference between the Baa corporate bond yield and the 10-yr Treasury yield, and for the yield curve he uses the difference between the 10-year US Treasury yield and the federal funds rate, which is an overnight rate. He concludes that “The probability of a large increase in the unemployment rate over the subsequent year implied by this approach as of the end of March 2022 is low, at about 5 percent.”
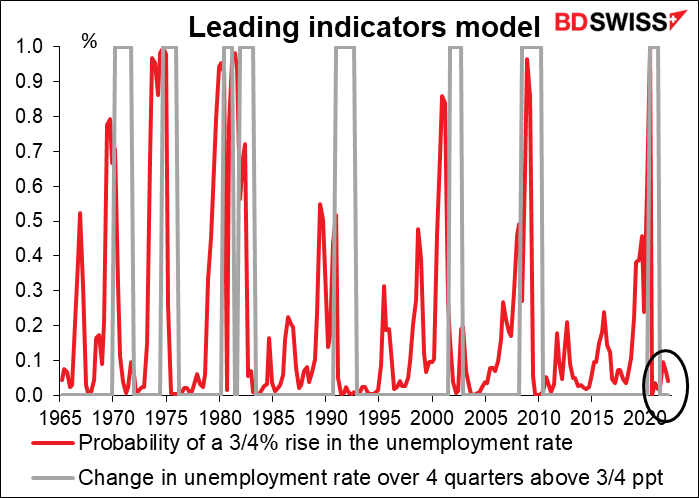
Another approach is to use so-called “leading indicators.” These are indicators that economists have identified as changing significantly before a recession. In this case, the author used the variables from the above model and added the change in the OECD’s composite leading indicator for the US. This includes a wide variety of economic indicators, such as consumer confidence, business confidence, production and labor market indicators, as well as financial variables like the yield curve. According to this model, the probability of a recession over the next four quarters from March was quite low, only 5%.
There’s some theoretical support for the idea that the consumer price index (CPI) and the unemployment rate itself, added to financial variables, can predict large increases in the unemployment rate a year or more in advance. The author made a model including those two plus the credit spread and the yield curve from the initial model. This one gives a much worse estimate: “a sizable risk (above 50 percent) of a large increase in the unemployment rate over the next four quarters.” “Historically, elevated inflation and low unemployment have preceded recessions, consistent with the idea that such developments signal imbalances (overheated product and labor markets) that may unwind through an economic contraction,” he explained.
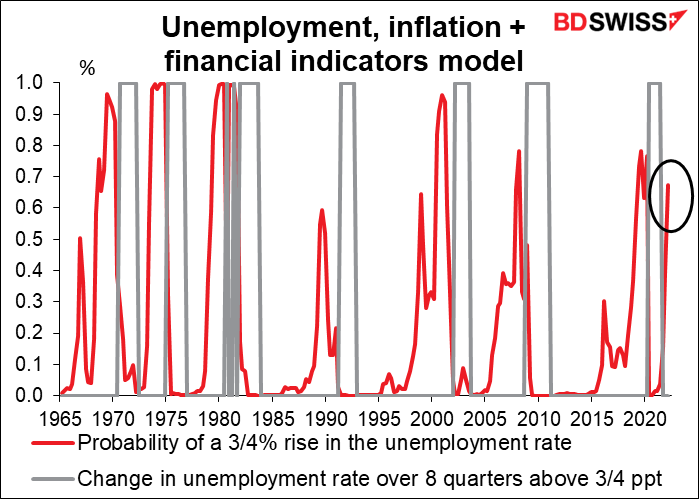
Unfortunately the author is a big fan of the above methodology because research shows that the unemployment rate and inflation are stronger predictors of recession risk, relative to financial variables, over horizons longer than four quarters. He therefore re-ran the model to find the probability of a large increase in the unemployment rate over the next eight quarters from March. Sorry to report that this approach “implies a more sizable risk of a large increase in the unemployment rate, of about 67 percent over the next two years.”
The author draws several conclusions from this analysis:
Conclusion: Back in March, a recession might have been likely in the next 12 months or maybe not. I’m sorry if that doesn’t answer the question but that’s all we can say for sure.
Of course there are some things we can hypothesize about, namely that A) the model using inflation and unemployment seems to do a better job than the model using just the yield curve; B) that better model was flashing bright red; and C) things have only gotten worse since then in that inflation is higher and unemployment lower. So a recession is certainly a possibility, perhaps a probability.
*Kiley, Michael T. (2022). “Financial and Macroeconomic Indicators of Recession Risk,” FEDS Notes. Washington: Board of Governors of the Federal Reserve System, June 21, 2022, https://doi.org/10.17016/2380-7172.3126.
By the way, the New York Fed also has a recession model based exclusively on the yield curve (3m rates vs 10-year rates). It uses monthly data and so is more up-to-date than the ones above, which use quarterly data (a lot has changed in the world since March!). This model too says only a low (4% or so) probability of a recession in the next 12 months.

Next week: US durable goods & personal spending/income, EU inflation, Japan tankan
There are no major central bank meetings scheduled next week but a lot of indicators coming out.
In the US, the main releases will be the durable goods orders (Mon) and personal income & spending (Fri), with their sidekick the personal consumption expenditure (PCE) deflators.
The headline durable goods figure is expected to be down from the month before at +0.1% mom vs +0.4%, but the less volatile figure excluding transportation equipment is forecast to show an unchanged increase of +0.4% mom.
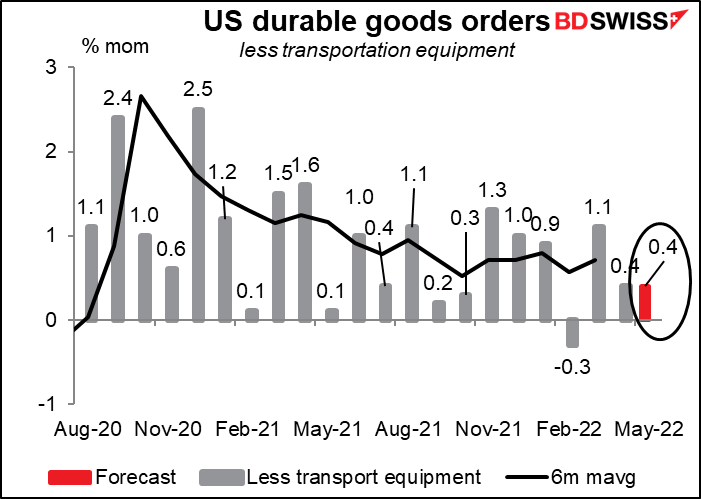
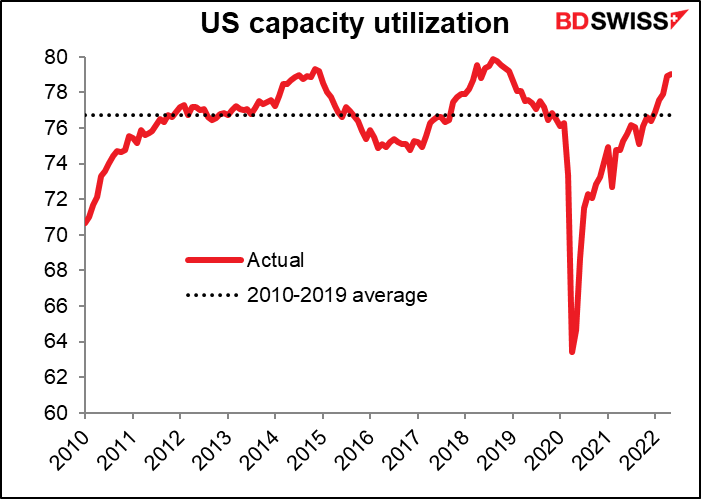
That’s good news in that it shows continued confidence in the economy – companies wouldn’t be investing if they didn’t think demand would continue. Also it will help to bring down capacity utilization, which at 79.04% is near the post-Global Financial Crisis high of 79.9%. Greater investment and therefore lower capacity utilization should mean less inflationary pressure.
Personal income is forecast to be up 0.5% mom, 0.10 bps more than in the previous month, while spending is forecast to be up 0.4% mom, which would be down sharply from +0.9% the month before. Growth in spending substantially exceeded growth in incomes three out of the first four months of the year. It would be only normal for people to cut back on spending after a run like that.
Nonetheless, the continued growth in both incomes and spending bodes well for the economy going forward. If people start cutting back on their spending, that would contribute to starting a recession because one person’s spending is another person’s income.
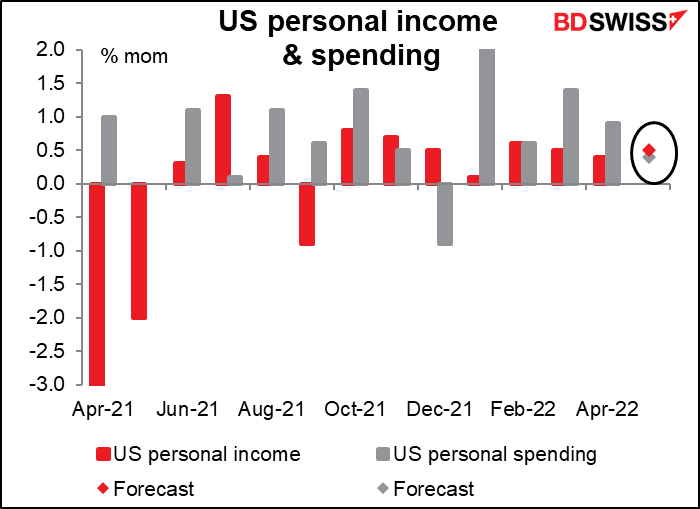
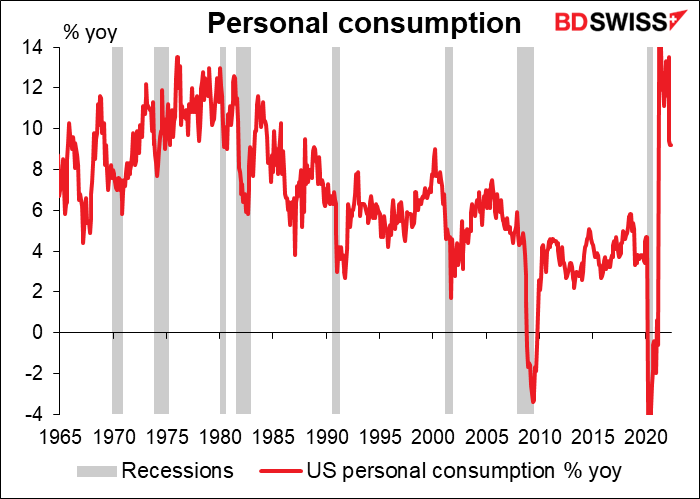
It does seem that spending growth slows ahead of or at least at the beginning of a recession. Looked at that way, growth in spending has been slowing recently, albeit from an extraordinarily high rate: up 9.2% yoy in April, which is still the fastest rate of growth since Jan. 1987 (excluding the immediate post-pandemic period). True, this is down from almost 30% yoy in April of last year (not shown on the graph) but that was distorted by the plunge in spending when the pandemic hit in 2020. So far, so good, I’d say.
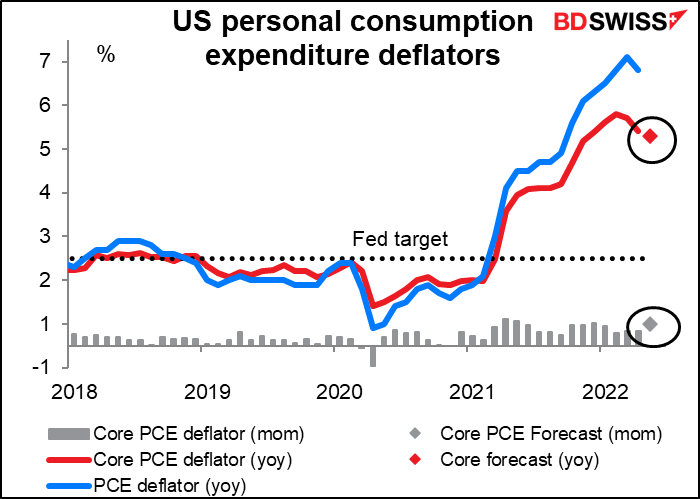
As for the personal consumption expenditure (PCE) deflators…I used to make a big fuss about these because they’re what the Fed uses in its official documents when it talks about “inflation” and also is what they say they are targeting, especially the core PCE deflator, which they said “historically has been a better indicator of where inflation will be in the future than the overall figure.” However I’ve noticed that when Fed officials speak they always refer to the consumer price index (CPI), not the PCE deflators. The market too puts a lot more weight on the CPI, as shown by the Bloomberg relevance scores (97 for the CPI mom, 60 for the PCE core deflator mom).
That’s a shame, because the story the PCE deflators are telling is different than what the CPI says. The PCE deflators have turned the corner. The April headline figure showed a slowing in inflation (from 6.6% yoy to 6.3% yoy) as did the core figure, which as did the core figure, which peaked at 5.3% yoy in February, slowed in March and April, and is expected to slow further in May, and is expected to slow further in May (4.8%). If indeed the core PCE deflator is a good indicator of the inflation trend, then maybe the Fed won’t have to tighten as much as people expect (or fear). Maybe we can avoid a recession. Maybe pigs can fly. In formation.
Other key US indicators coming out during the week include pending home sales (Mon), wholesale inventories and Conference Board consumer confidence index (Tue), the final estimate of Q1 GDP (Wed), and the ISM manufacturing index (Fri).
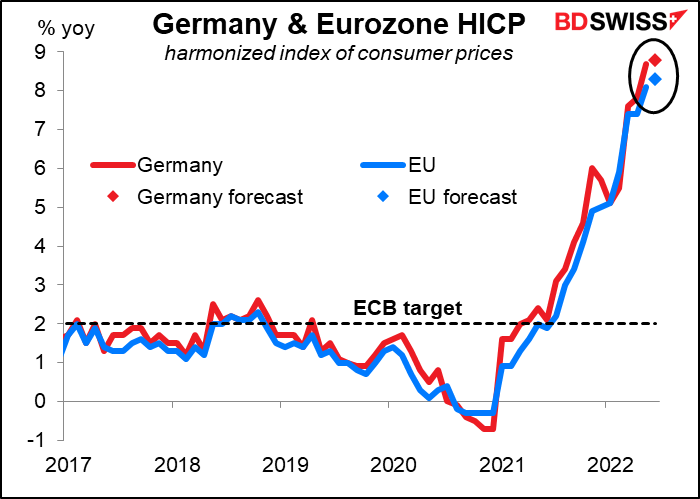
For Europe, the focus will be on inflation data: Germany on Wednesday, EU-wide on Friday. They’re both expected to rise further, by 0.10 percentage point in the case of Germany and 0.20 percentage points for the EU as a whole. That may increase the pressure from the hawks on the European Central Bank (ECBI) Governing Council to hike rates by 50 bps or even more in September (or even at the first hike, scheduled for July 21st), which could be positive for the euro.
EG Bundesbank President Nagel Thursday warned that inflation expectations are becoming “de-anchored” and the ECB risks falling behind the curve. “If monetary policy falls behind the curve, even stronger hikes in interest rates could become necessary to get inflation under control,” Nagel said. “This would create much higher economic costs.” I’m sure several of his colleagues agree with him on this.
Other notable EU figures will be the EU money supply data (Wed) and German employment (Thu)
The end of the month is always a big time for Japanese indicators and the end of the quarter is even bigger as it brings with it the biggest of the Japanese indicators, the Bank of Japan’s Short-Term Economic Survey of Enterprises in Japan, fondly known by one and all by its Japanese acronym, the tankan. The BoJ surveys some 10,000 companies and comes up with an incredibly detailed mass of data on the corporate world broken down by industry and size. As the BoJ says,
The Tankan grasps overall corporate activity by combining a judgment survey, which covers the responding enterprises’ views on the current state of and outlook for such items as their business conditions and economic developments, and a quantitative survey, which covers the actual results and forecasts for the responding enterprises’ business plans, including figures for sales, profits, and fixed investment.
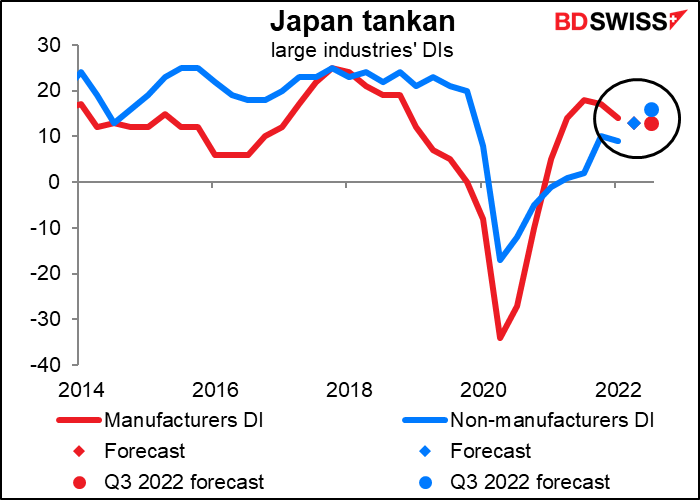
There’s lots in there for corporate analysts and stock market prognosticators, but for us FX folks, the main thing to follow are the large industry diffusion indices (DI). These are the percentage of respondents who say conditions are “favorable” minus those who say conditions are “unfavorable” (leaving out those who say they are “not so favorable.” Large manufacturers are the key here, both because they dominate the economy and also because they dominate the export sector. The large manufacturers’ DI is forecast to fall one point to 13. The tankan also includes companies’ forecasts of how things will be one quarter from now; the market’s forecast for that forecast is also 13 (which is why there’s only one red dot in the graph). For large non-manufacturers, their DI is expected to rise by 4 points and for the Q3 estimate to rise a further 3 points.
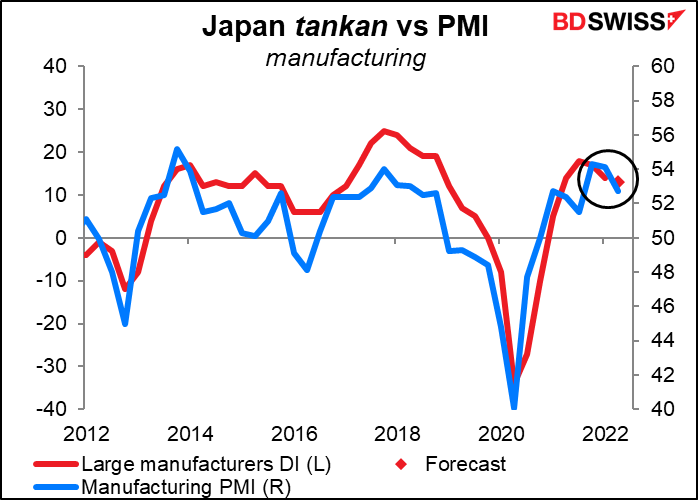
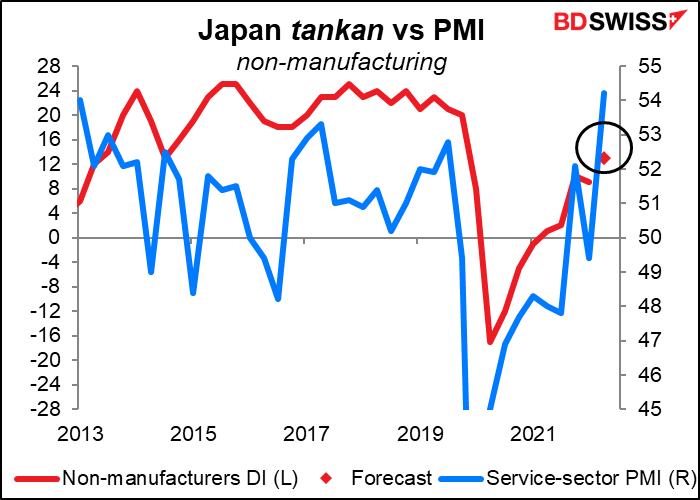
These forecasts coincide with the recent slowdown in the manufacturing PMI vs the sharp increase in the service-sector PMI.
It should be “Japan will also release the closely watched Tokyo CPI (Fri). It’s expected to show the inflation rate creeping up by 0.1 percentage point to a shocking 2.5% yoy headline figure (which would be the same as the April and May national figures). In other words, no great acceleration of inflation that would convince the Bank of Japan to change course. That could be negative for the yen.
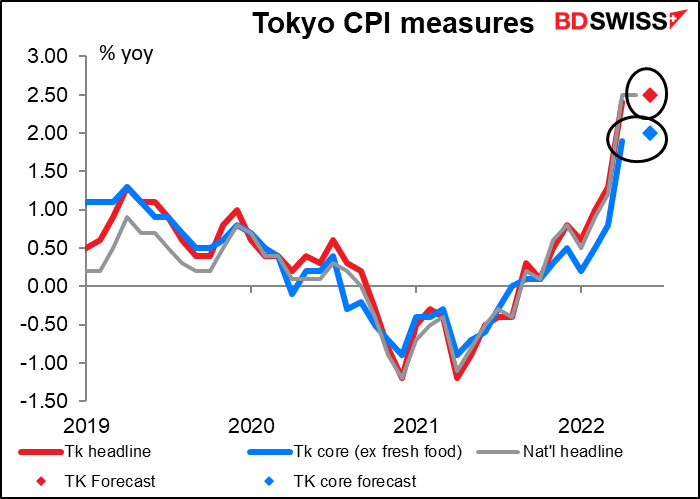
Inflation is a hot topic in Japan right now in the race for the Upper House election, scheduled for July 10th. The opposition parties have taken a leaf from the Republican handbook and are making a fuss about “Kishida inflation,” blaming the PM for Japan’s staggering 2.5% yoy inflation rate (hahaha! Most countries would be delighted to have that).
But the prices that people see every day are rising much faster than the overall level. Food prices are up 4.0% yoy, largely due to volatile fresh food prices (+12.2% yoy). That’s the fastest rise in food prices since Dec. 1991, excluding periods when the consumption tax was hiked.

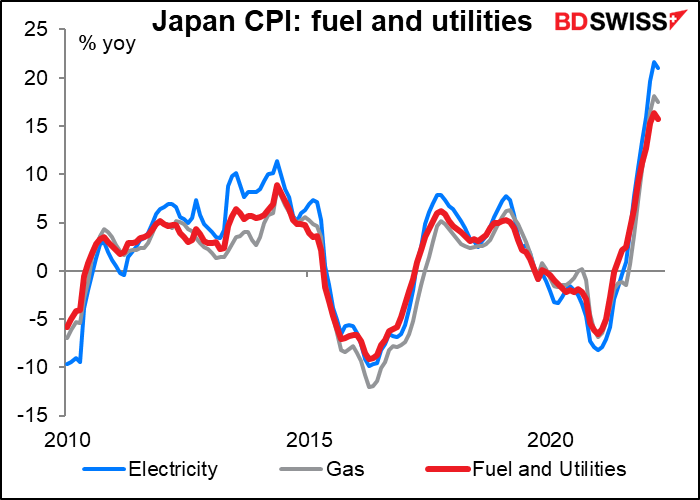
And fuel and utilities prices are soaring too, as you can imagine (I’m sure yours are soaring as well). This is far and away the highest increase since the second oil shock of 1979/80, when oil prices more than doubled in the wake of the Iranian revolution and the beginning of the Iran-Iraq war.
It remains to be seen whether the government will budge. So far PM Kishida has stuck to his guns, arguing that low interest rates were necessary to support businesses while the weak yen was a separate problem that should be dealt with separately from monetary policy.
Other indicators out during the week include retail sales (Wed), industrial production (Thu), and employment (Fri).
There are few major UK indicators out during the week, only the final revision of Q1 GDP (Thu) and mortgage approvals (Fri). But UK politics and the brouhaha with the EU over the Northern Ireland Protocol should give the market food for thought, especially after the Conservative Party lost two by-elections on Thursday. Will PM Boorish Johnson be dislodged? If so, who will take his place? Keep watching!
Canada releases its monthly GDP for April on Thursday.
Australia releases retail sales (Wed) and employment data and private sector credit (Thu).
New Zealand building permits come out on Friday.