BDSwiss App
Download & start trading

Rates as of 05:30 GMT
Market Recap
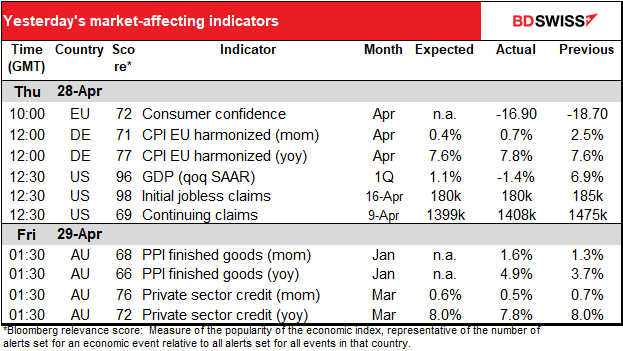
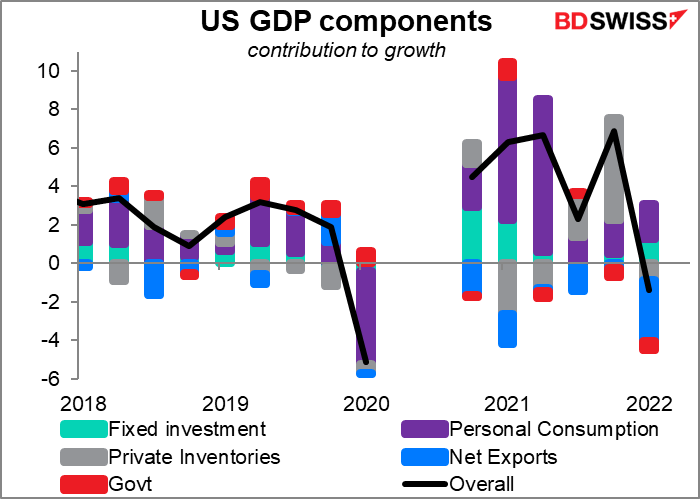
That was a surprise! US Q1 GDP was expected to have risen +1.0% qoq SAAR in Q1 but instead contracted 1.4%. Oops! But analysts rushed to explain that the figures aren’t as bad as they look. Personal consumption rose by 2.7% up from 2.5% in Q4 2021, and business investment accelerated to +9.2% from +2.9%. But there was a large drag from net exports thanks to a record US trade deficit (probably because US demand recovered faster than global demand) and a surprise drop in government spending plus some drag from inventories, which grew at a slower pace than in Q4.
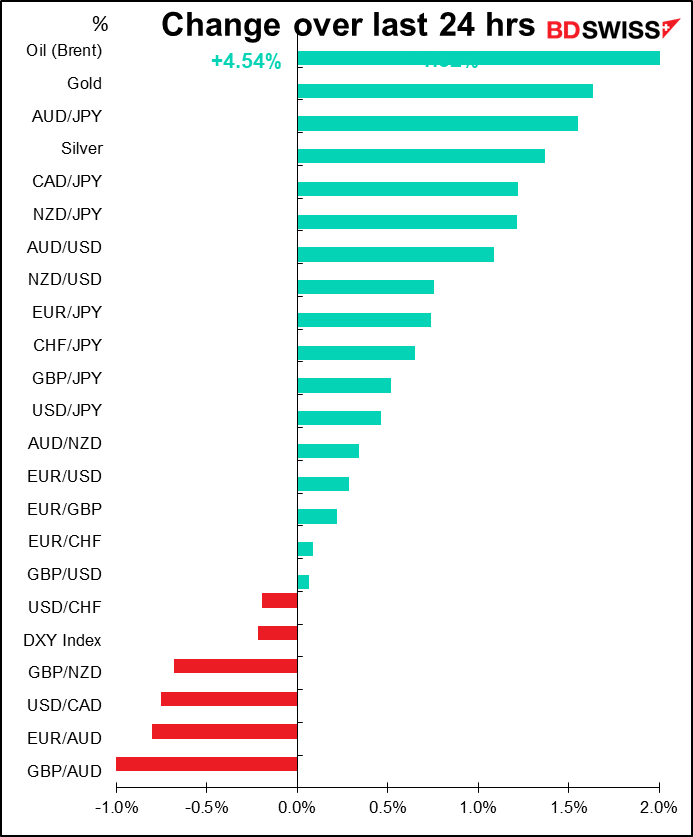
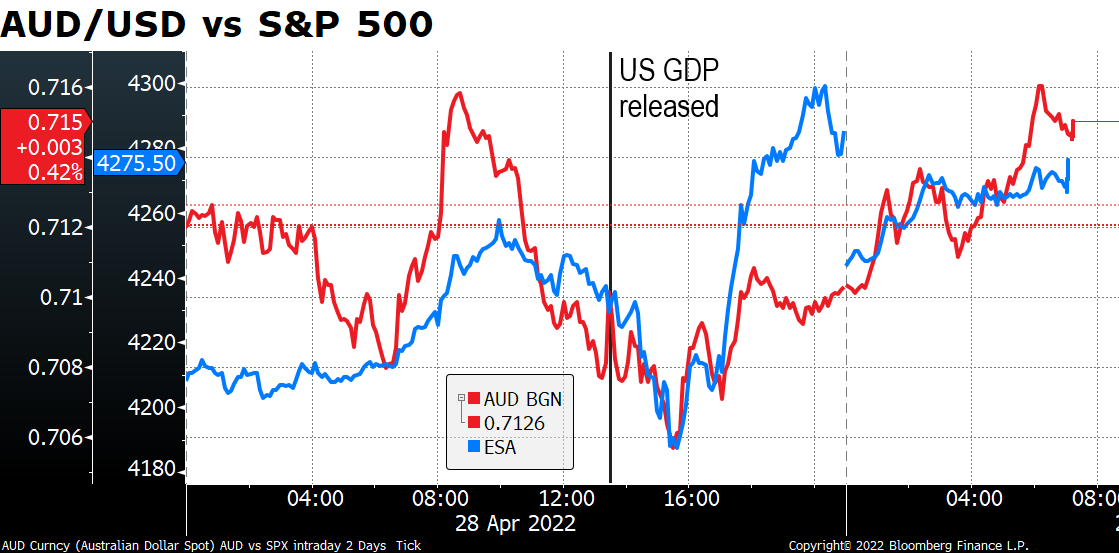
The surprisingly slow growth didn’t hinder the commodity currencies, which recovered from midday losses to trade higher.
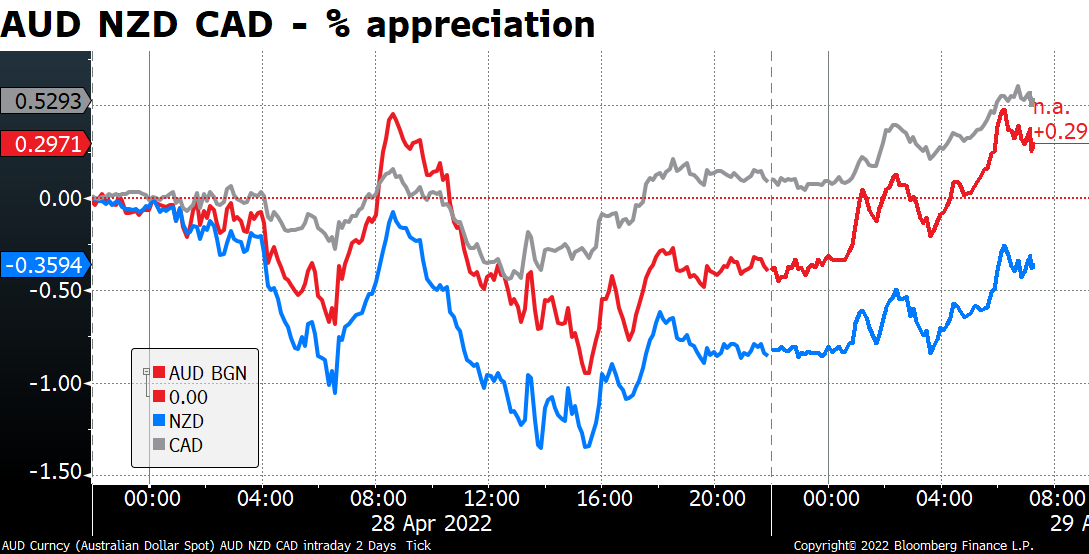
They largely followed stock markets, which managed to rebound after the GDP figures were released. Market talk attributed the rebound to better-than-expected subscriber numbers from The Company Formerly Known As Facebook, although those numbers came out after the close on Wednesday and didn’t prevent a fall early Thursday. Nonetheless, every sector in the S&P 500 was up by more than 1%.
There was also a big miss in the German inflation figures, which rose 7.8% yoy, the fastest rate since 1950. The market had expected inflation to remain at the previous month’s 7.6% yoy rate. Only five of the 26 economists polled by Bloomberg had expected a number that high or higher. This suggests an upward surprise is likely for today’s Eurozone-wide CPI too.
EUR/USD continued to decline despite the surprisingly high German inflation, which makes it more likely that the European Central Bank (ECB) will tighten early, and the disappointing US GDP figure. The pair briefly fell through 1.05 for the first time since early 2017, although it has since recovered slightly.
ECB apologizes for bad inflation forecasts
The failure of economists to predict the German inflation figure is nothing new. Ahead of today’s release of the Eurozone-wide consumer price index (CPI) (see below), the ECB apologized for its bad inflation forecasts. In an article in this month’s Economic Bulletin, What explains recent errors in the inflation projections of Eurosystem and ECB staff?, the ECB’s researchers said their poor record in forecasting inflation was mostly due to “unexpected developments in energy prices, coupled with both the effects of reopening following the removal of coronavirus-related restrictions and the effects of global supply bottlenecks.”
The ECB overestimated future inflation for many years, but started underestimating inflation from Q1 last year. Things got worse from Q3. As the Financial Times (FT) pointed out, “inflation has consistently risen faster than the ECB predicted for the past year…stirring up criticism, even from members of the central bank’s own governing council, about the weakness of its forecasting models.” Its forecast for Q1 this year was its worst ever: it predicted the Eurozone’s inflation rate would fall to 4.1% yoy from 4.7% but instead it shot up to 6.1%.
I can’t blame them. Energy prices rose an almost unprecedented amount last year. The ECB’s forecasters use the futures market when forecasting energy prices and the futures market didn’t predict these surges, either. Moreover, energy companies passed on the higher wholesale prices to retail prices almost immediately, whereas historically it’s taken them three to 12 months.
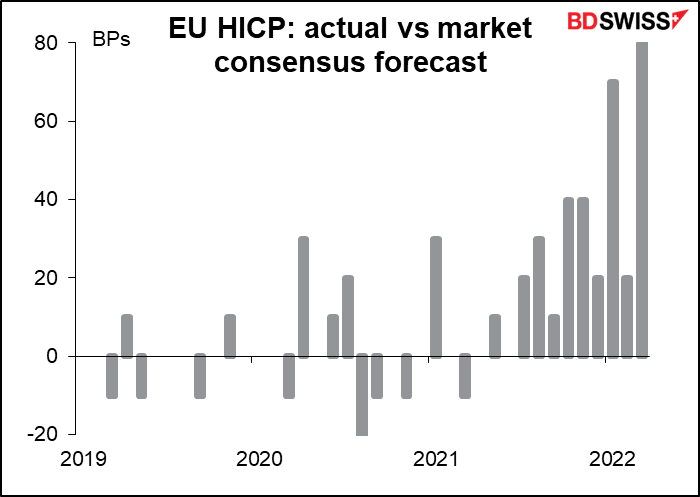
The forecasters noted in their defense that “international institutions and private forecasters have recently made similarly large errors” and its record was no worse than the Fed and Bank of England. And indeed the market consensus forecast for EU-wide inflation has gotten worse over time too, with market economists also underestimating inflation.
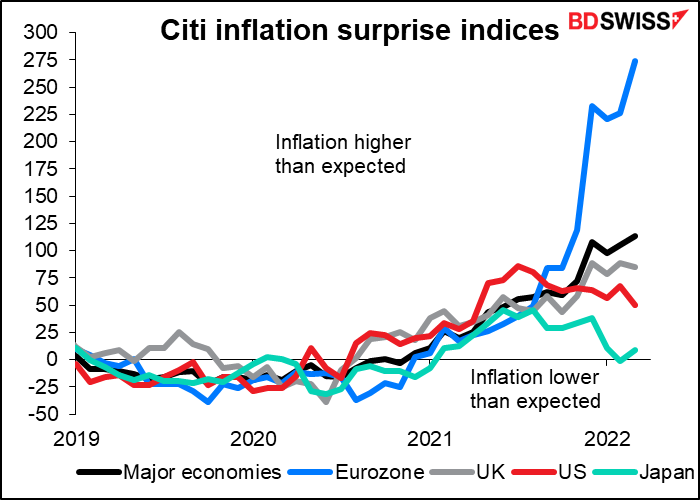
If we look at the Citi inflation surprise indices, which measure how much actual inflation varies from the market consensus forecast, we can see that Eurozone inflation surprised on the upside much, much more than other countries’ figures did.
Still, it’s a lesson we in the market should remember. As US baseball legend Yogi Berra once said, “it’s tough to make predictions, especially about the future.” Or as an analyst who came in last in The Wall Street Journal’s quarterly poll of analysts once said, “if you think people can predict the economy, then you probably believe in Santa Claus and the Easter Bunny too.”
Today’s market
Note: The table above is updated before publication with the latest consensus forecasts. However, the text & charts are prepared ahead of time. Therefore there can be discrepancies between the forecasts given in the table above and in the text & charts.
We’ve had a pretty light week for indicators up to now, but today is different.
The EU money supply figures aren’t so important nowadays because of the money supply growth, which used to be one of the “pillars” of the European Central Bank (ECB) monetary strategy but not anymore. Instead, the focus is on the bank lending data, which shows how well the ECB’s policy is being transmitted to the economy. Total growth in lending fell in February thanks to the mysterious “other” category. I expect though that it would take a more substantial downturn than this to dissuade the ECB from the path of righteousness aka tightening.
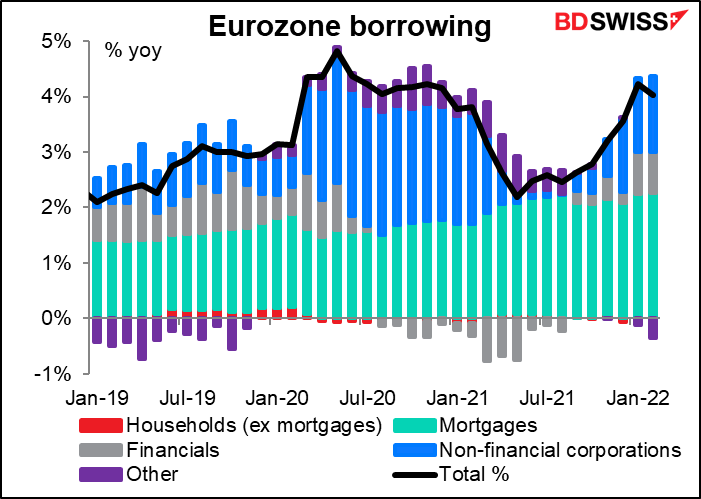
There does seem to be some connection between money supply growth and inflation a year later, though.

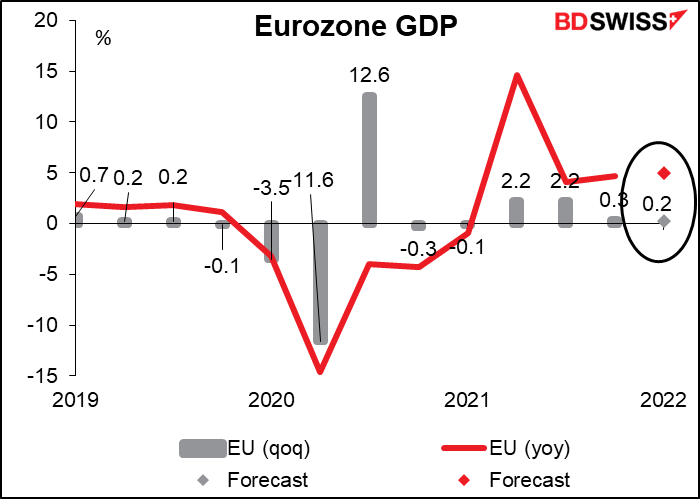
The Eurozone GDP figures come out today. We get Q1 GDP from France, Spain, Italy, Germany, and the Eurozone as a whole, as well as a couple of other smaller countries.
German GDP is forecast to be up just slightly.

Eurozone GDP as a whole is expected to do not much better. The market consensus forecast of +0.2% qoq is the same as the ECB staff forecast. “Real GDP growth is expected to remain subdued in the first quarter of 2022 amid tighter mobility restrictions, persistent supply disruptions, high energy prices and the conflict in Ukraine,” the ECB said.
The expected increase in output would be in line with the Eurozone composite PMI/
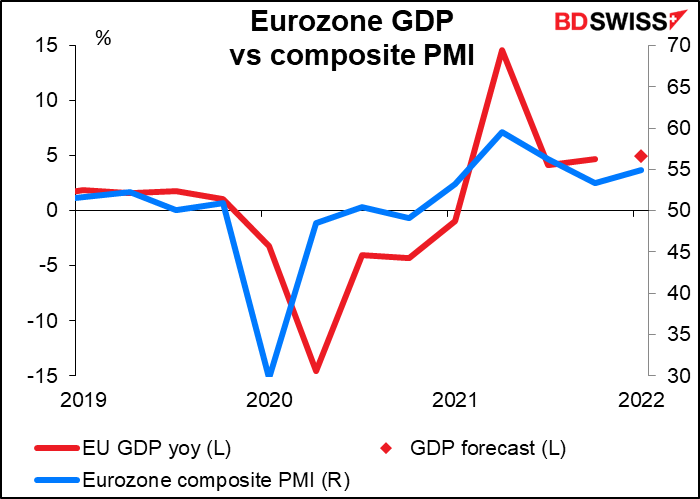
I’m not sure how much importance the market will put on these figures given the uncertainties that lie ahead. The war in Ukraine is having a large impact on the Eurozone economy and will have an even greater impact as countries try to wean themselves off of Russian energy. On the other hand, the PMIs show surprising resilience so far: the Eurozone composite PMI for April was up 0.9 point on the month to 55.8. contrary to popular expectations (the market had been looking for a 1-point decline).
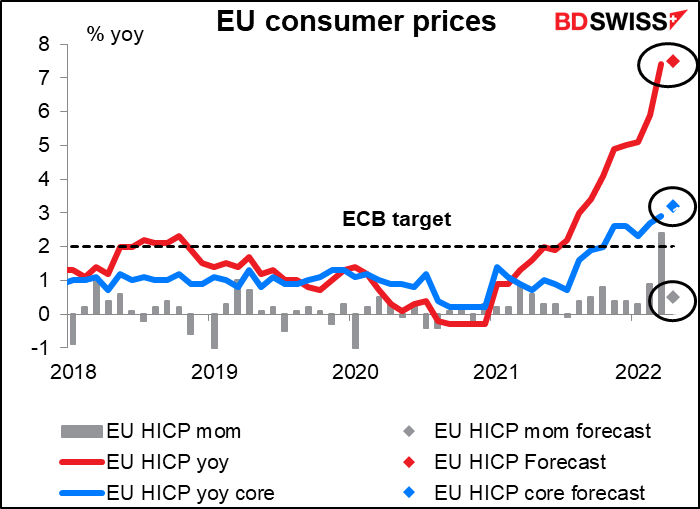
The Eurozone consumer price index (CPI) will also be released today. Germany’s CPI, announced yesterday, was higher than expected (see table above). The yoy rate rose to +7.8% yoy from +7.6% yoy, instead of remaining unchanged as expected. The market forecast for the EU-wide figure, made before the result of Germany’s figure was known, was for the headline rate of inflation to also remain unchanged at a record-high 7.5% yoy.
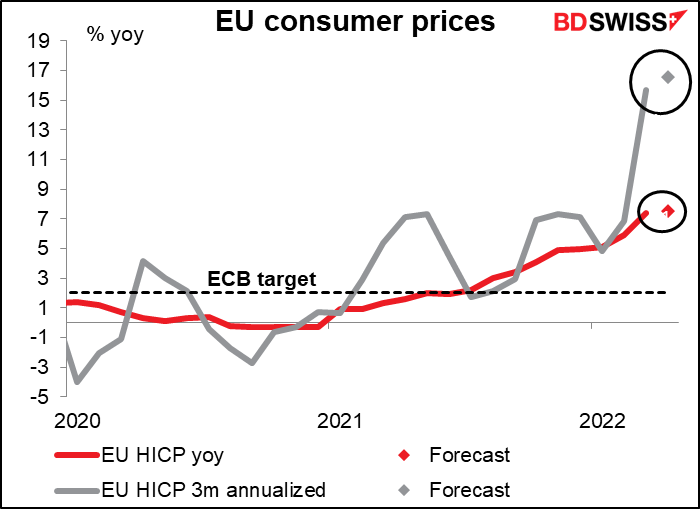
That doesn’t necessarily signal a peak in Eurozone inflation though. If we look at the three-month rate of change in headline inflation and annualize it, it’s expected to rise further this month, indicating that inflationary pressures remain strong. I doubt if this figure will do anything to calm the ECB. In that respect it could prove EUR+.
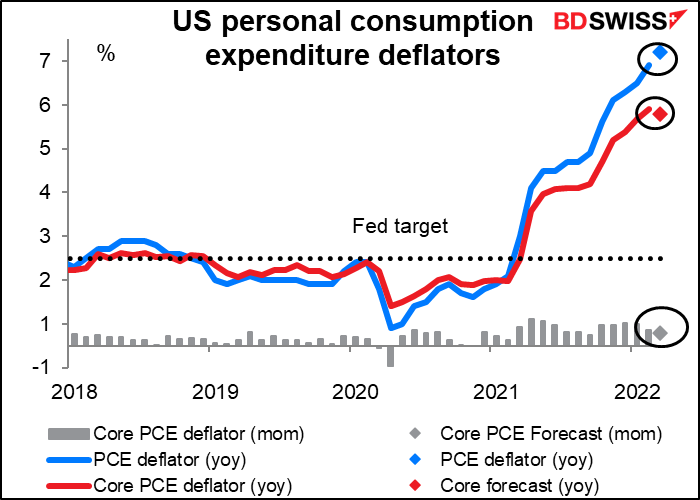
When the US comes in, we get the US personal income and spending data, which also brings with it the personal consumption expenditure (PCE) deflators.
The PCE deflators, not the consumer price index (CPI) are the Fed’s preferred inflation gauges. That is, when the Fed makes its forecasts for inflation, it forecasts the PCE deflators, not the consumer price index (CPI), as it considers the PCE deflators (particularly the core PCE deflator) to be a better indicator of future inflationary trends.
However the market pays more attention to the CPI as shown by the relatively low Bloomberg relevance score for the PCE deflators (60.1 is the highest, vs 96.1 for the CPI). For that matter, when members of the rate-setting Federal Open Market Committee (FOMC) talk about inflation, they usually refer to the CPI rather than the PCE deflators. (If you’re interested in finding out more about the PCE deflators and how they differ from the CPI, please see our Market Insight piece on this subject, PCE Deflator: the Little Indicator that should be Bigger.)
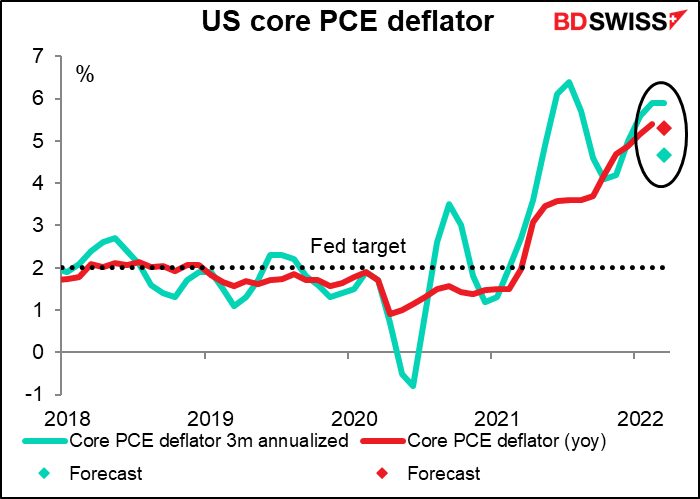
The yoy rate of change of the headline PCE deflator is expected to rise further, but the core measure is forecast to fall by 0.1 percentage point. That’s not much but it could signal the beginning of a turnaround in inflation.
The three-month annualized rate of change of the core CPI deflator is expected to show some serious deceleration, which could add to the sense that inflation is peaking. But as with the ECB mentioned above, I doubt if this first indication of a peak in inflation would do anything to dent the Fed’s resolve to hike rates. Inflation is still way too high for them to just rest and hope it comes down naturally. Even the more dovish Committee members have expressed support for a 50 bps hike in May and urged an “expeditious” or “methodical” move to more neutral policy levels.
As for the personal income & spending figures, they’re both expected to rise slightly, with spending expected to rise a bit more than incomes (sound familiar?). These are quite healthy levels – on these forecasts, incomes would be 12.1% higher than the pre-pandemic level and spending would be 13.8% higher. This suggests that the Fed may have to tighten significantly to dampen demand enough to bring inflation down. That’s USD+.
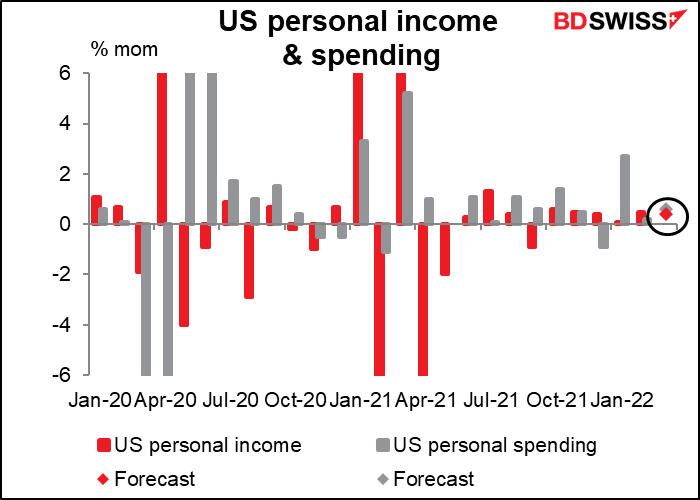
In any case, the PCE deflators show much better correlation with the subsequent movement of the exchange rate than the personal income & spending figures do. The former are therefore the ones that FX market participants should watch.
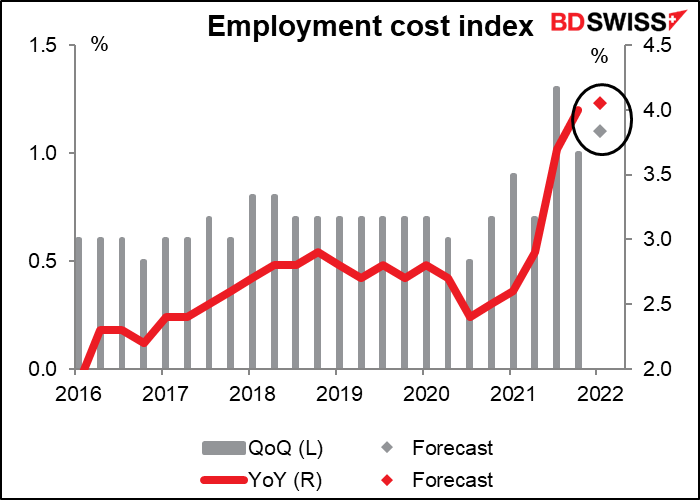
While we’re still discussing inflation, the less well-known quarterly employment cost index (ECI) is coming out as well. The ECI provides an accurate measure of labor cost inflation because it corrects for the different rates of wage gains in different sectors. Fed officials follow this indicator closely. The 1.3% qoq surge in Q3 last year was one of the key factors that precipitated the Fed’s hawkish pivot. Today’s figure is expected to show an acceleration in wage gains, which will only convince Fed Chair Powell further that he can hike rates without sending the US economy into recession (good luck with that!). In a panel discussion at the IMF meeting last week, Powell characterized the labor market as “extremely tight, historically so.”
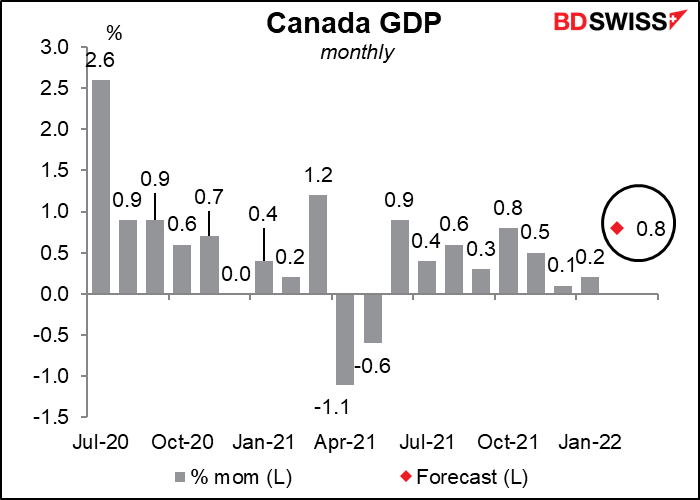
One more important indicator today, at least for those trading CAD: Canada’s monthly GDP figure. The figure is expected to show relatively robust growth as most industries — manufacturing, construction, accommodation, food services, and extraction industries (mining, quarrying, oil and gas extraction) have expanded, according to the preliminary figures, whereas only utilities output has been lower, as far as we know. The Bank of Canada has already started an aggressive tightening cycle, hiking by 50 bps at its recent meeting (April 13th). “In Canada, growth is strong and the economy is moving into excess demand,” they said after that meeting. This kind of number will only confirm that view and lead to more rate hikes. It’s probably positive for CAD as a result.
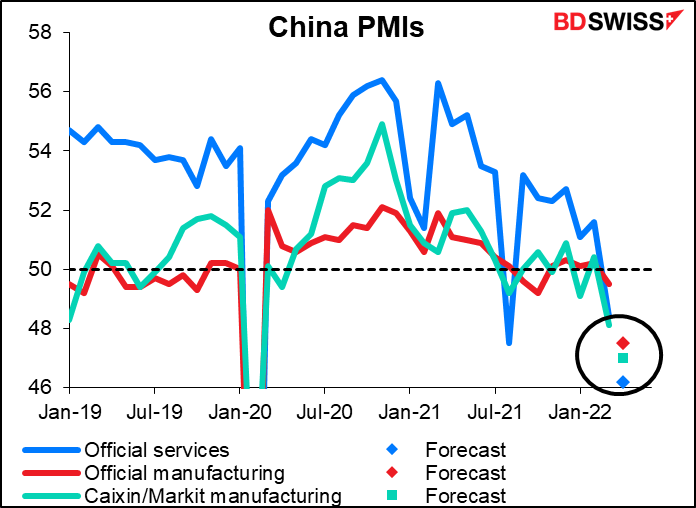
Over the weekend we get the official Chinese purchasing managers’ indices (PMIs) plus the Caixin/Markit manufacturing PMI. These will be closely watched as they’re the first reading on how China’s “zero-COVID” policy has affected industry. Expectations are pretty grim. Sharply lower China PMIs could weigh on the opening of stock markets on Monday and dampen sentiment toward AUD.